US inflation at 3.4%: reading the Fed's next move
US inflation rose to 3.4% in August with core at 2.4% — the gap that framed the Fed's September hike. Here is the print's anatomy and what it says about the path ahead.
News
Central bank decisions, economic data, gold and oil, and plain-English guides to how currency trading works. Every article links to its primary sources.
US inflation rose to 3.4% in August with core at 2.4% — the gap that framed the Fed's September hike. Here is the print's anatomy and what it says about the path ahead.
US retail sales rose 1.2% in August after a July fall — the consumer's resilience in one number. Here is what the rebound says about growth, the Fed's path and the dollar.
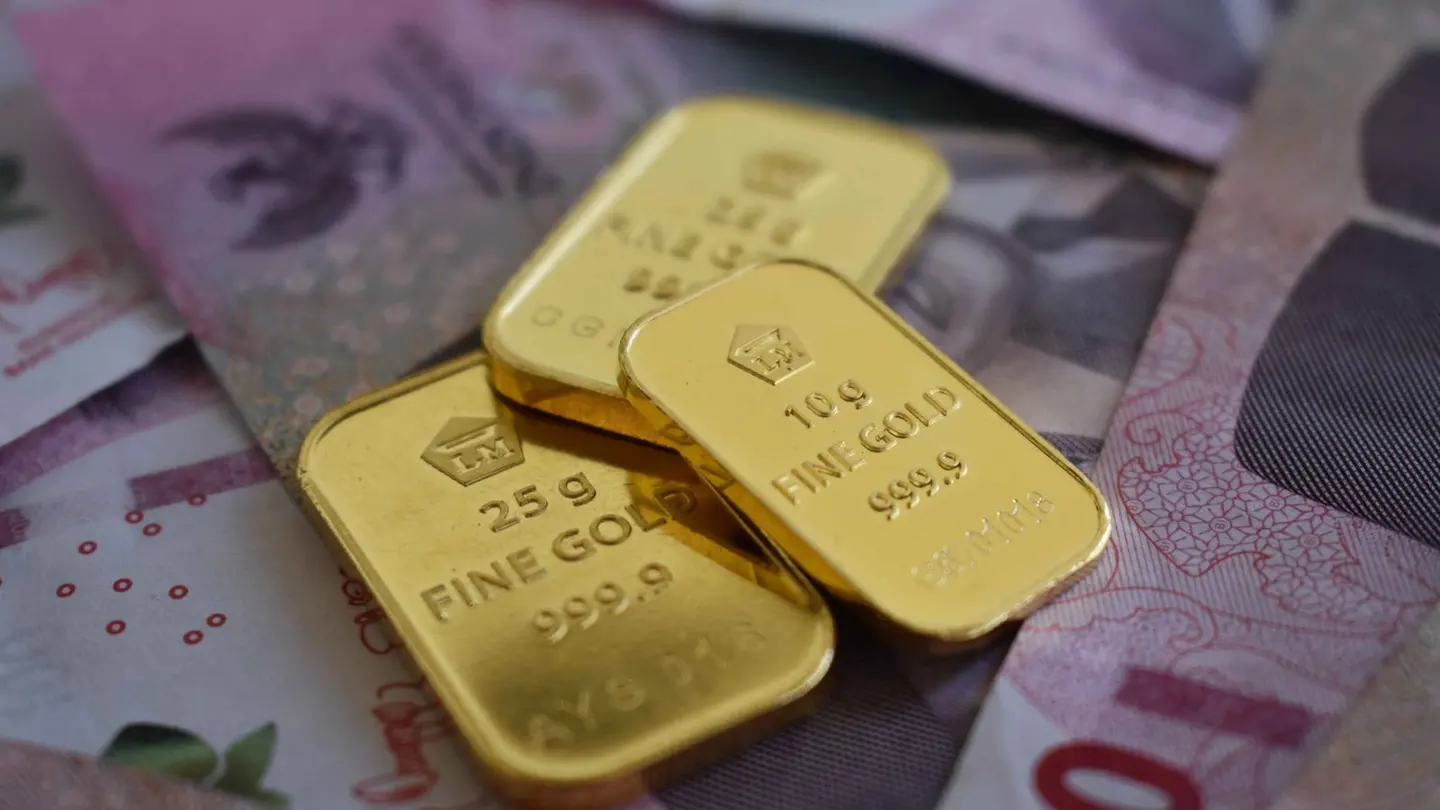
Gold set a record of $5,589 in January and traded near $4,300 in September. Here is what changed in between — real yields, the dollar and the fear premium — and what it means for the metal now.
Two trades on correlated pairs are often one trade twice the size. Here is how to measure the correlation, group your exposure, and keep several positions from becoming one bet.
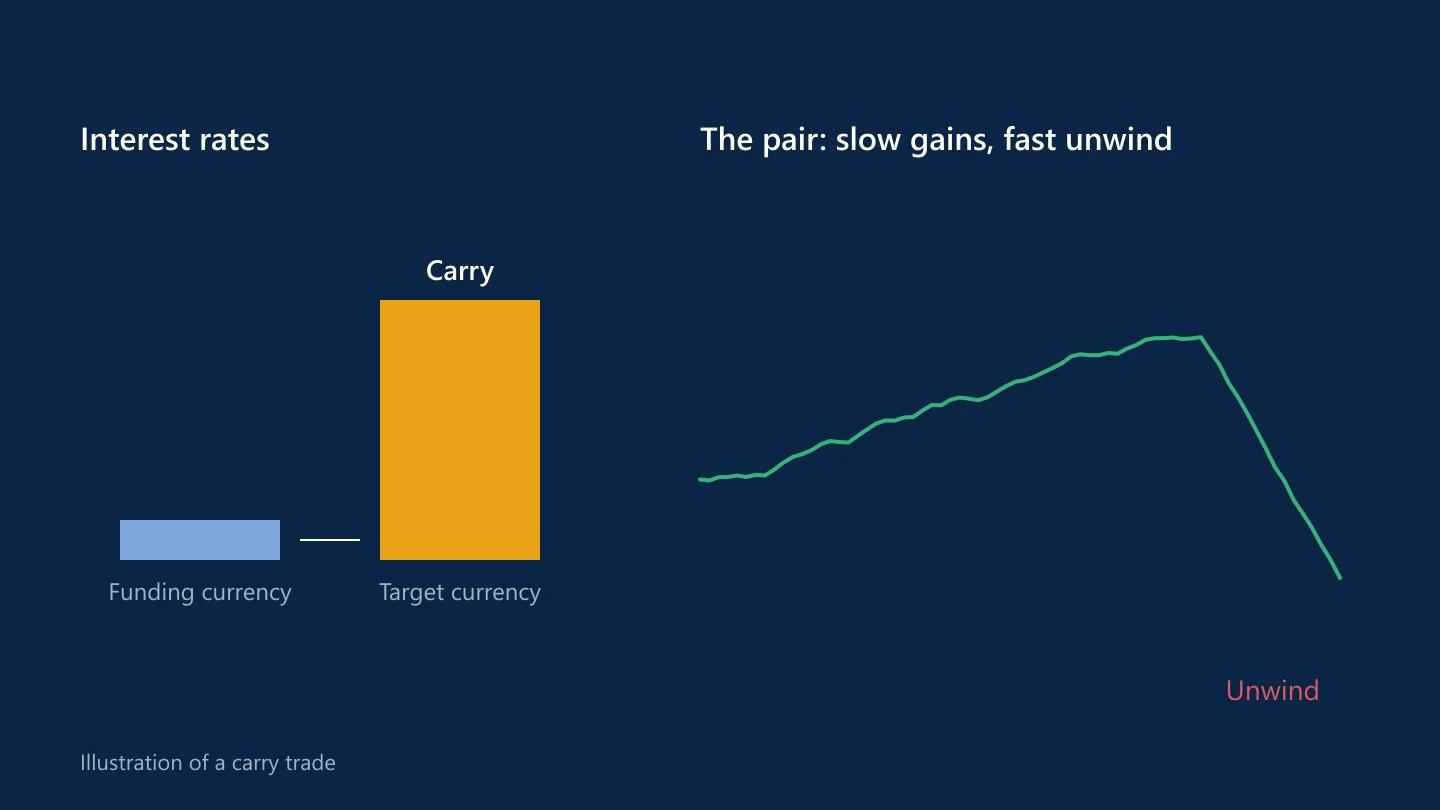
A carry trade earns the interest difference between two currencies — and survives on risk rules, because the unwind is violent. Here is how to construct one properly.
Japan and the US intervened jointly in July to support the yen — a rare coordination that still shapes every yen trade. Here is what happened, why it worked, and what the authorities do next.
Brent has traded above $100 a barrel since early September as Hormuz shipping dwindles. Here is what triple-digit oil does to the commodity currencies, the importers and the inflation picture.
Fuel prices are pushing inflation up across the UK, the US and Canada — and the central banks are answering differently. Here is the shock's anatomy, its fingerprints in the data, and what it means for currencies.
Central banks tell markets what they are likely to do next, so the future is priced before it happens. Here is what forward guidance is, how it works, and why the guidance sometimes fails.
Central banks move rates in basis points, charts move in pips and accounts measure in percentages — three units for the same market. Here is what each means and how to convert between them.
The forex market trades around the clock, but the liquidity does not — it flows through Sydney, Tokyo, London and New York in waves. Here is what each session brings and why the clock matters as much as the chart.
The forex market has no central exchange — it is a layered network of banks, brokers and liquidity providers. Here is the structure, who sits on the other side of your order, and why it matters.
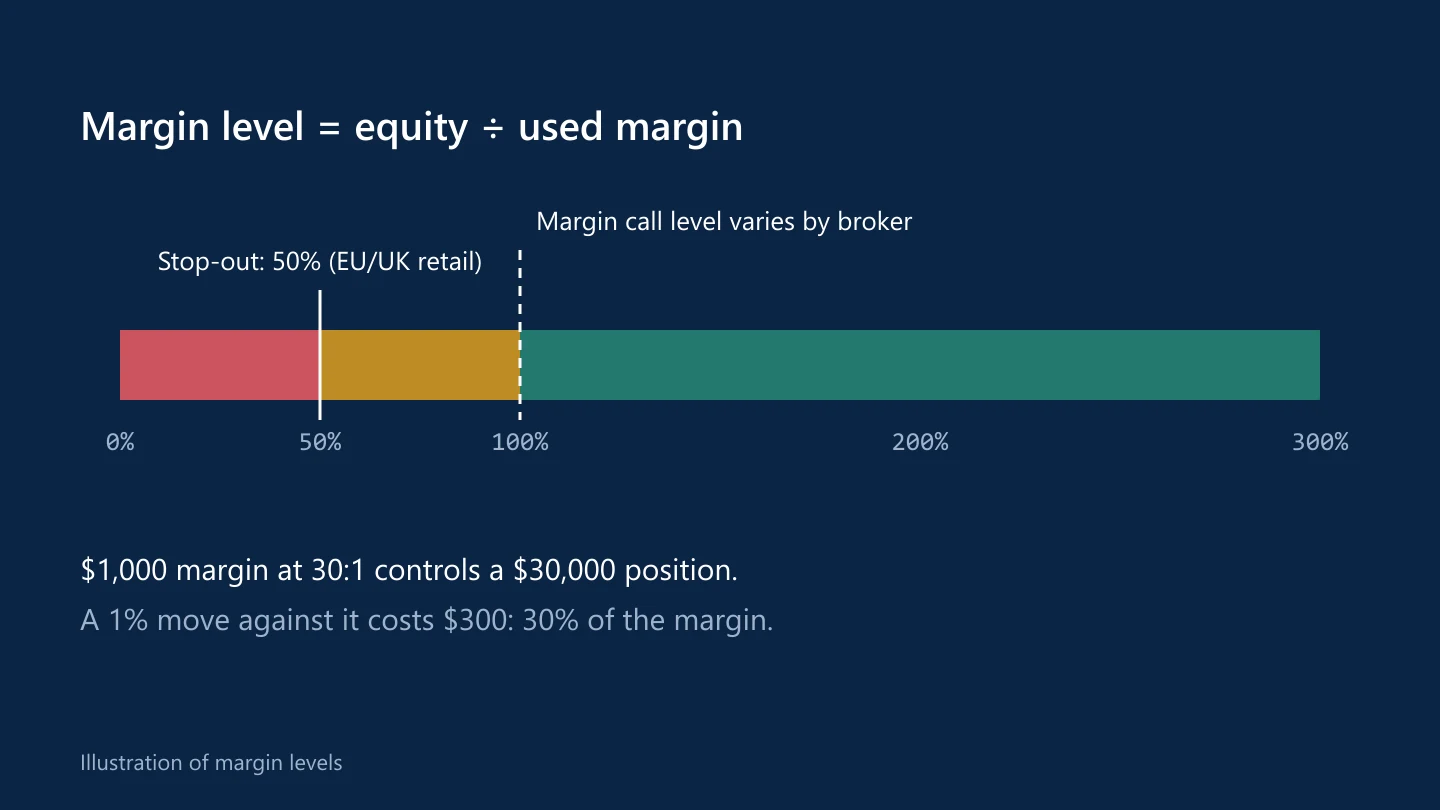
A margin call is the broker's warning, and the stop-out is the moment positions close automatically. Here is the exact sequence, the numbers that trigger it, and how to never meet it.
The symbol specification window holds the answers to most trading complaints — spreads, swaps, margin, lot sizes, trading hours. Here is how to read it and what each field actually means.
When a broker goes under, what happens to client money depends on segregation, the regulator and the compensation scheme. Here is the process, the protections and the gaps.
The spread you see at 3 p.m. is not the spread you get at 8:30. Here is what liquidity actually does to spreads, when the widening hits, and how to plan around the worst windows.
Every weekday around 5 p.m. New York time, open positions are rolled to the next value date and swap is charged. Here is what rollover actually is, why triple swap exists, and what it costs you.
Oil prices feed inflation, inflation feeds central banks, and central banks feed currencies — the chain runs from Brent to every pair on the board. Here is the full transmission, with the current cycle as the case study.
Gold pays no interest, so it competes with what bonds pay after inflation — real yields. Here is what real yields are, how to read them, and why they explain gold's moves better than the dollar ever does.
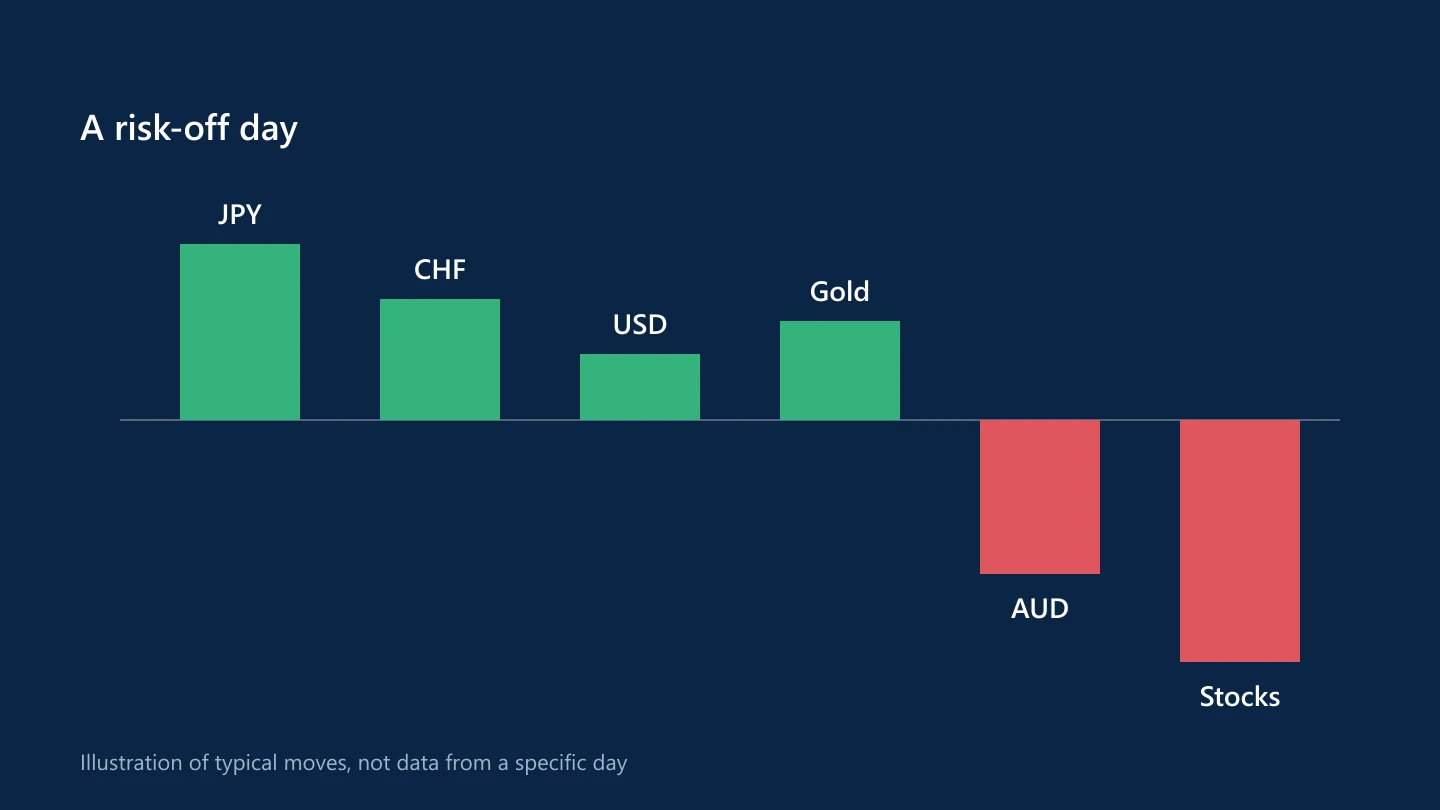
Risk sentiment decides which pairs trend and which reverse before any data lands. Here is a five-minute morning read — the instruments that show the mood and what they mean for your pairs.
Traders say 'watch the 10-year' as if it were obvious — and for the dollar pairs it nearly is. Here is what the yield actually measures, how it reaches currencies, and which pairs track it closest.
Central bank statements are written in a coded language, and the market hangs on every word change. Here is how the code works, which words carry weight, and how to read a statement like a trader.
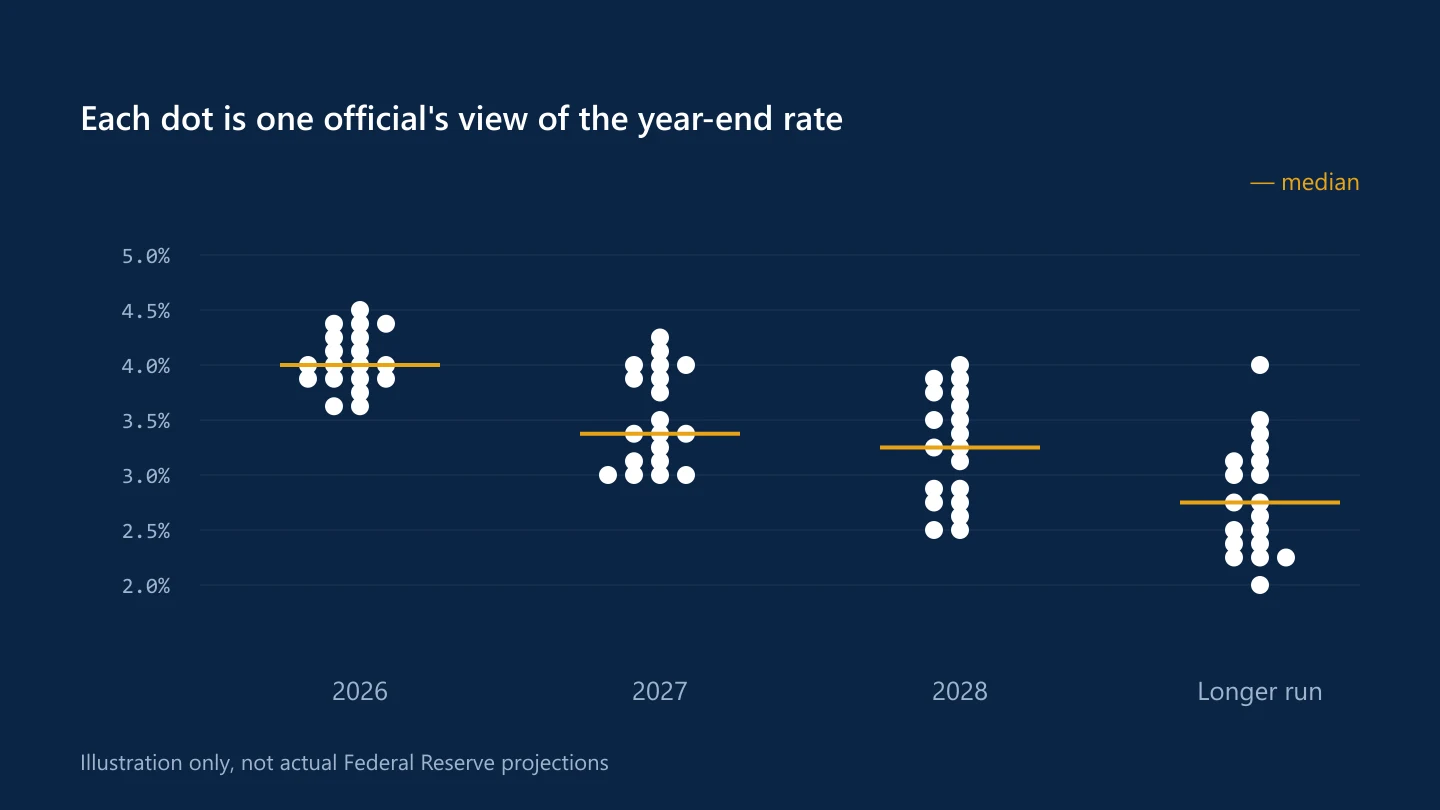
Four times a year, the Fed publishes anonymous rate projections — the dot plot — and the dollar reprices on the median. Here is what the dots actually show, how the market reads them, and where the surprises hide.
USD/CAD has two masters: the oil price and the interest-rate gap between the Fed and the Bank of Canada. Here is how each channel works, which one leads, and how to read the tug-of-war.
The Australian dollar is a China proxy, a commodity currency and a risk barometer rolled into one. Here is how the three roles interact, which one leads, and the signals that tell you.
USD/JPY is the pair where US yields meet the Bank of Japan — with the threat of intervention sitting over both. Here is the three-force driver map and how they take turns leading.
Cable answers to the Bank of England, the UK's data calendar and sterling's political weather — on top of everything that moves the dollar. Here is the full driver map and how the stories interact.
EUR/USD is the market's default pair, and five forces decide its direction — with US rate expectations leading the list. Here is each driver, how they interact, and which one is in charge on any given day.
Inflation is the input central banks watch most closely, which makes CPI the release that moves currencies most. Here is the transmission chain — from print to policy to price — and why the details beat the headline.
Bollinger Bands measure how stretched price is — and stretched markets can stretch further. Here is what the bands actually show, when to fade the touch and when to ride it, and how to trade the squeeze.
RSI is the most popular oscillator in trading and the most misread. Here is what it actually measures, where its signals work, where they fail, and how professionals use it as a filter rather than a trigger.
Stops and targets decide the economics of every trade before it starts. Here is the R-based method: anchor the stop to structure, set the target from the risk, and let the maths filter the trades.
The higher time frame sets the direction, the middle finds the setup, the lower times the entry — but each added frame adds conflicts. Here is a three-frame system that stays simple.
The New York open — overlapping London's afternoon — is the busiest, fastest window in forex. Here is what happens in it, which pairs come alive, and how to trade the overlap with a plan.
Fake brokers clone real brands, invent regulators and design websites that look more professional than the genuine article. Here are the checks that expose them before the deposit leaves your account.
The broker is the most important business decision a trader makes, and the marketing makes it hard. Here is the checklist that cuts through it — regulation first, costs second, everything else after.
The demo-to-live switch is where trading changes from a game to a business, and the transition usually goes badly. Here is a staged process that turns it into a ramp instead of a cliff.
The weekly review turns a week of trades into a week of lessons — the habit that separates traders who improve from traders who repeat themselves. Here is the framework, the metrics and the decisions it produces.
Drawdowns are statistically guaranteed, and how you trade inside one decides whether it becomes a memory or a catastrophe. Here is the recovery framework that protects the account while it heals.
Entries get studied; management gets improvised — yet the hours after entry decide most of the outcome. Here is a framework for managing a live position without micromanaging it to death.
The calendar is the trader's weekly map: which releases matter, which pairs they move, and which days to trade small or not at all. Here is a Sunday-evening routine that turns it into a plan.
The dollar index condenses the dollar's strength against six currencies into one number — and its euro-heavy weighting shapes everything about how it trades. Here is how to use it as a filter, a signal and an instrument.
The offshore yuan trades inside a policy-managed band, with the PBOC's daily fix setting the frame. Here is how the managed float works and how to trade around it.
The South African rand pays one of the highest carries in the liquid EM complex and charges for it in volatility. Here is how the pair works, what drives the rand, and how to trade it without being run over.
The Mexican peso is the liquid emerging-market currency: high carry, deep market, and sensitivity to US policy and risk appetite. Here is how the pair works and how to trade it.
Crude is the world's most political market, with two benchmarks, weekly inventory data and a rollover quirk that surprises new traders. Here is how it works and how to trade it.
Silver follows gold's macro story and adds its own industrial demand layer — and its swings are wilder than either. Here is what drives it, how it differs from gold, and how to trade it without oversized risk.
The Swiss franc is a safe haven and an SNB-managed currency at once, and USD/CHF trades both stories. Here is how the two faces interact, what the SNB's zero rate means, and how to trade the pair.
The New Zealand dollar is the smallest major and one of the least understood. Here is what drives the kiwi, how the RBNZ's aggressive style shapes it, and how to trade a pair few others watch carefully.
The Australian dollar is a China proxy, a commodity currency and a risk-appetite barometer all at once. Here is how the three roles interact, which one leads, and how to trade the pair.
USD/CAD answers to two masters: the oil price and the interest-rate gap between the Fed and the Bank of Canada. Here is how the pair works, when each master dominates, and how to build a plan around it.
The market closes Friday and reopens Sunday, and the price in between can be very different. Here is why gaps happen, what they do to your stops, and how to trade — or simply survive — the Monday open.
The first hour of a session is the most liquid, most volatile and most deceptive hour of the day. Here is what happens in it, why most first-hour trades fail, and how to trade it without becoming the liquidity.
Markets spend more time ranging than trending, and most trend systems bleed in the chop. Here is how to define a range precisely, trade its edges, and recognise the moment it ends.
The moving average is the oldest trend tool in trading and the most misused. Here is what it actually measures, how professionals use it as a filter and a level, and why crossover systems need extra care.
Price action is the market's own language — candles, structure and levels, read in context. Here is how professionals read it, what the rejection signatures mean, and how to practise until it becomes instinct.
Position sizing is the calculation that keeps one bad trade from becoming a bad month. Here is the four-step method, with worked examples for dollar pairs, yen pairs and crosses.
Leverage multiplies both the gains and the losses, and the account usually learns this before the trader does. Here is how offered leverage differs from used leverage, and how to set yours so a bad week stays a bad week.
Trend trading is simple in description and brutal in execution: small losses, long waits and the occasional trade that pays for everything. Here is how to define a trend, enter it on pullbacks and stay in it without getting shaken out.
Support and resistance are the market's most used concepts and most misused lines. Here is how professionals draw them as zones, which touches count, and how to turn a level into a complete trade.
Most breakouts fail, and the ones that succeed usually let you in on the retest. Here is how to separate real breaks from stop-hunts, where to place the stop, and how to size the trade.
Fibonacci levels are everywhere on charts and nowhere near as precise as their fans claim. Here is what the retracement actually is, which levels matter, and how to trade it with the hindsight removed.
The first ninety days decide whether a beginner becomes a trader or a cautionary tale. Here is a month-by-month plan that keeps the account alive while the skills form.
The dollar is one side of nearly every trade, the world's reserve currency and the pricing unit for commodities. Here is why its moves ripple through every pair, every market and every trading plan.
A Fed rate hike reprices the dollar against everything, but the move isn't always what the textbook says. Here is the transmission chain — expectations, yields, carry and risk — and what the September 2026 hike showed.
Rate decisions move currencies through the vote, the statement and the press conference — not just the rate itself. Here is how to read all four parts and trade the day with the risk controlled.
Non-farm payrolls is the most scheduled-and-scripted volatility in forex. Here is what the report actually measures, why the details beat the headline, and how to trade the day with a plan instead of a guess.
CPI mornings move every dollar pair at once, and the first move often lies. Here is how to read the report properly, what the market actually reacts to, and three ways to trade inflation day with the risk controlled.
A trading plan is the difference between a system and a mood. Here is exactly what belongs in one, how to write it in an afternoon, and why the losing-streak test decides whether it is real.
Gold moves in dollars per ounce, not pips, and its daily range dwarfs most currency pairs. Here is what actually drives the metal, how position sizing differs from forex, and how to trade it without getting shaken out.
USD/JPY pays you for the rate gap and threatens you with intervention. Here is how the Bank of Japan, US yields and the threat of sudden yen-buying operations all fit into one trading plan.
GBP/USD, nicknamed cable, is the most volatile of the major dollar pairs. Here is what drives it, how its session behaviour differs from EUR/USD, and how to build a plan around its moods.
EUR/USD is the most traded currency pair in the world, with the tightest spreads and the deepest liquidity. Here is what moves it, when it moves, and how to build a trading plan around it.
News moves currency pairs faster than anything else in the market. Here is how to trade news releases with a plan, not a prayer — including the releases that matter, the risks around the release minute, and three strategies that respect both.
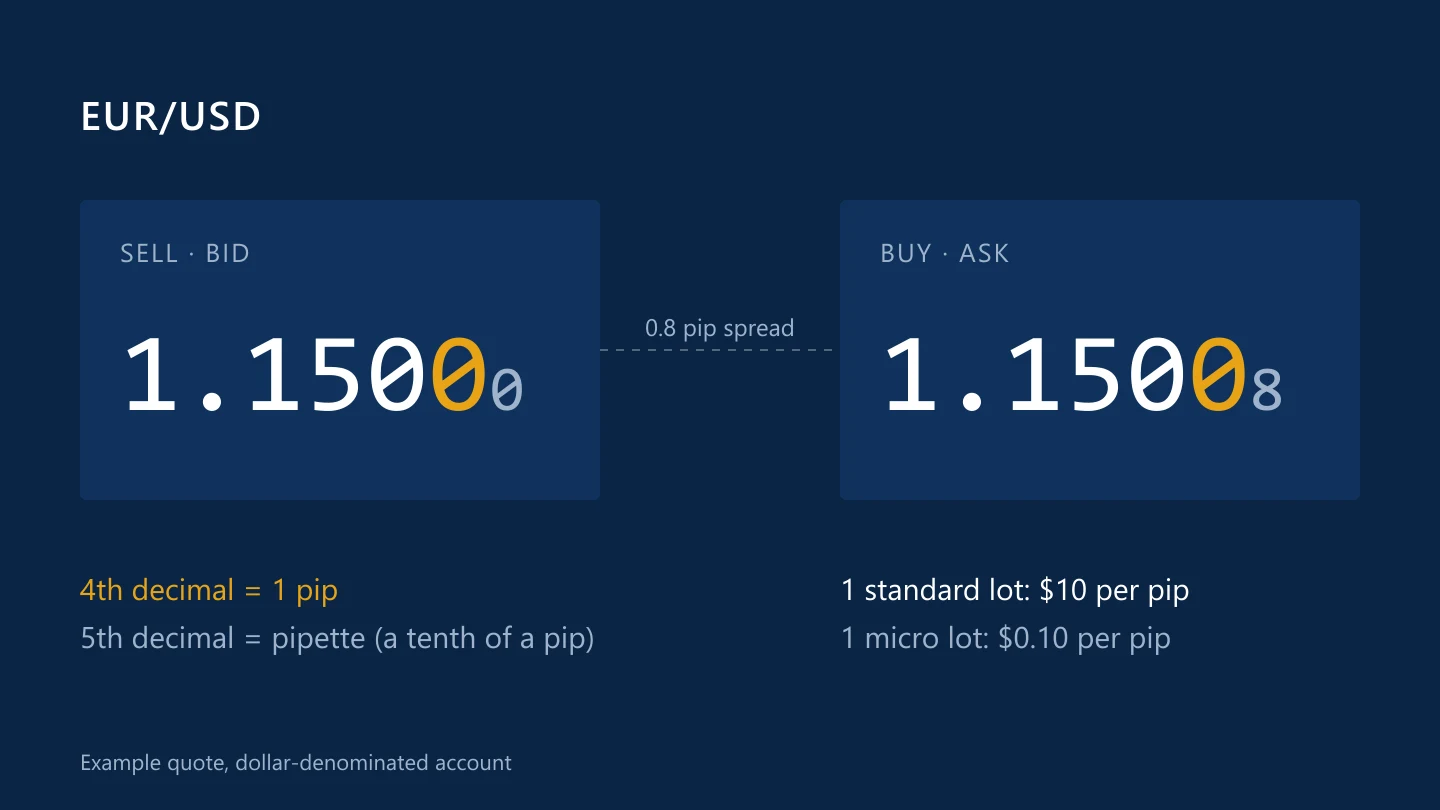
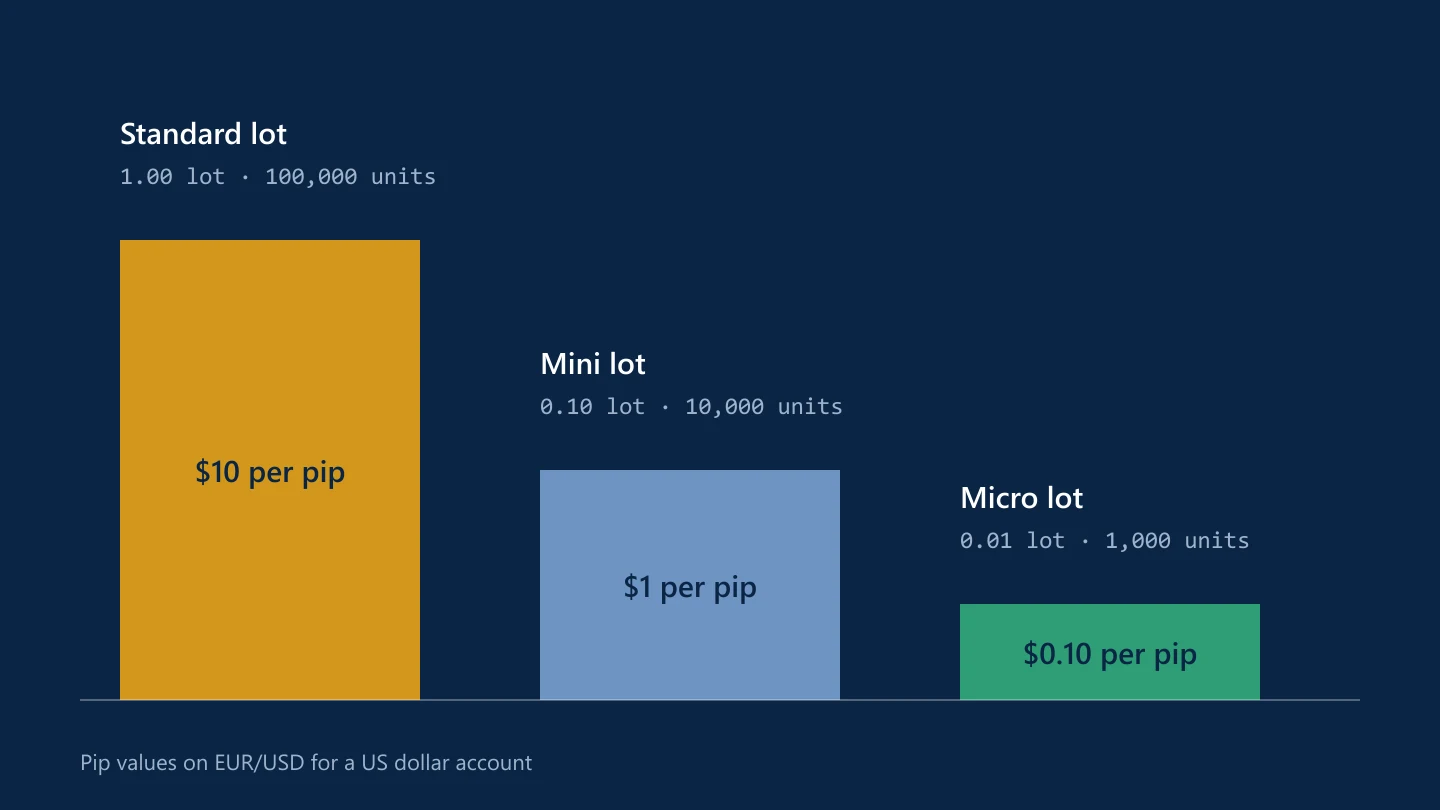
A pip is the smallest standard price step in a currency pair. Here is how pips, pipettes and pip values work on EUR/USD, USD/JPY, crosses and gold.
A lot sets how many units of currency you buy or sell. Getting it wrong is the fastest way to turn a small price move into a large loss.
Leverage lets you control a large position with a small deposit. It magnifies losses exactly as much as gains, and it is behind most blown trading accounts.
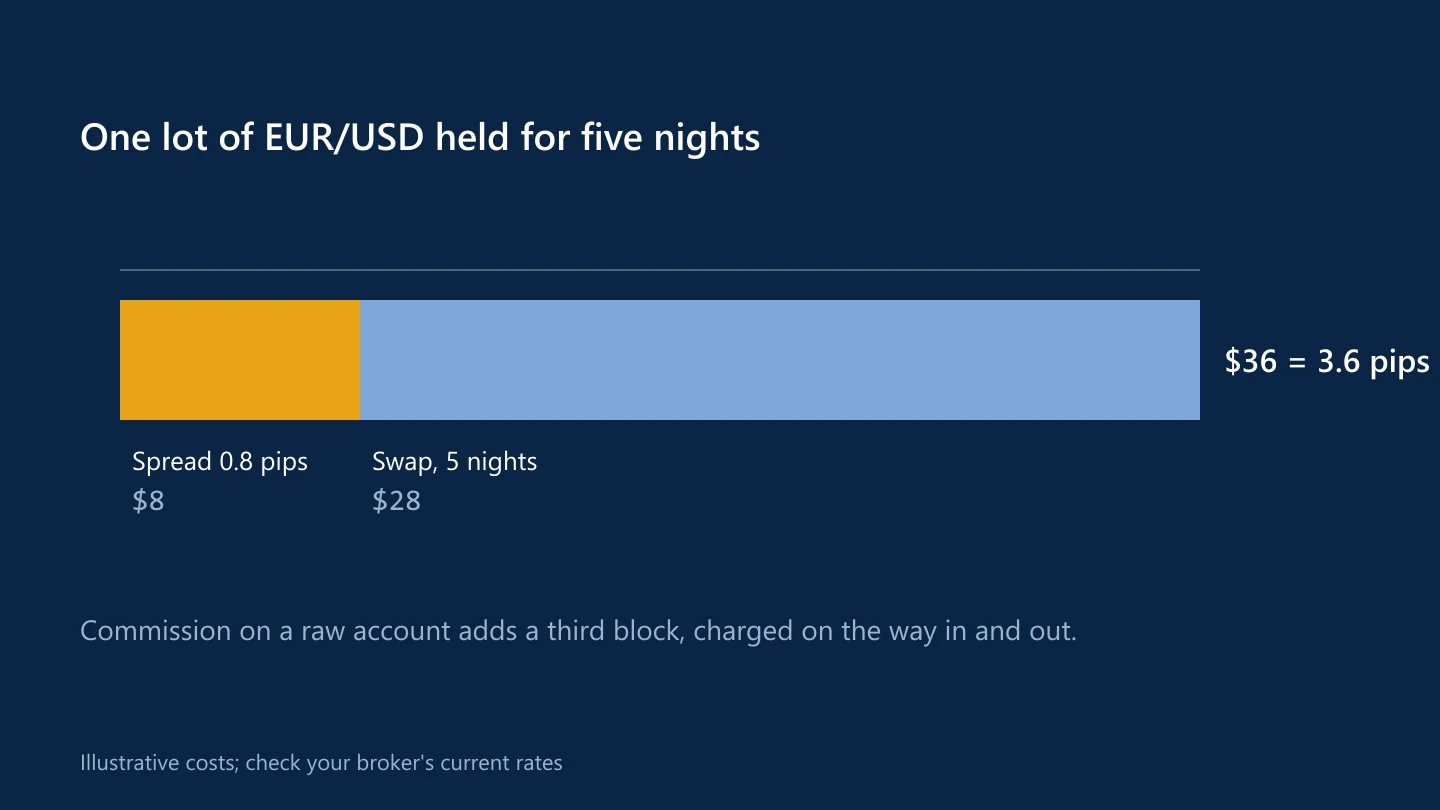
Every trade has costs, and they are easy to underestimate. Here is how to add up the spread, commission and overnight swap on a position.
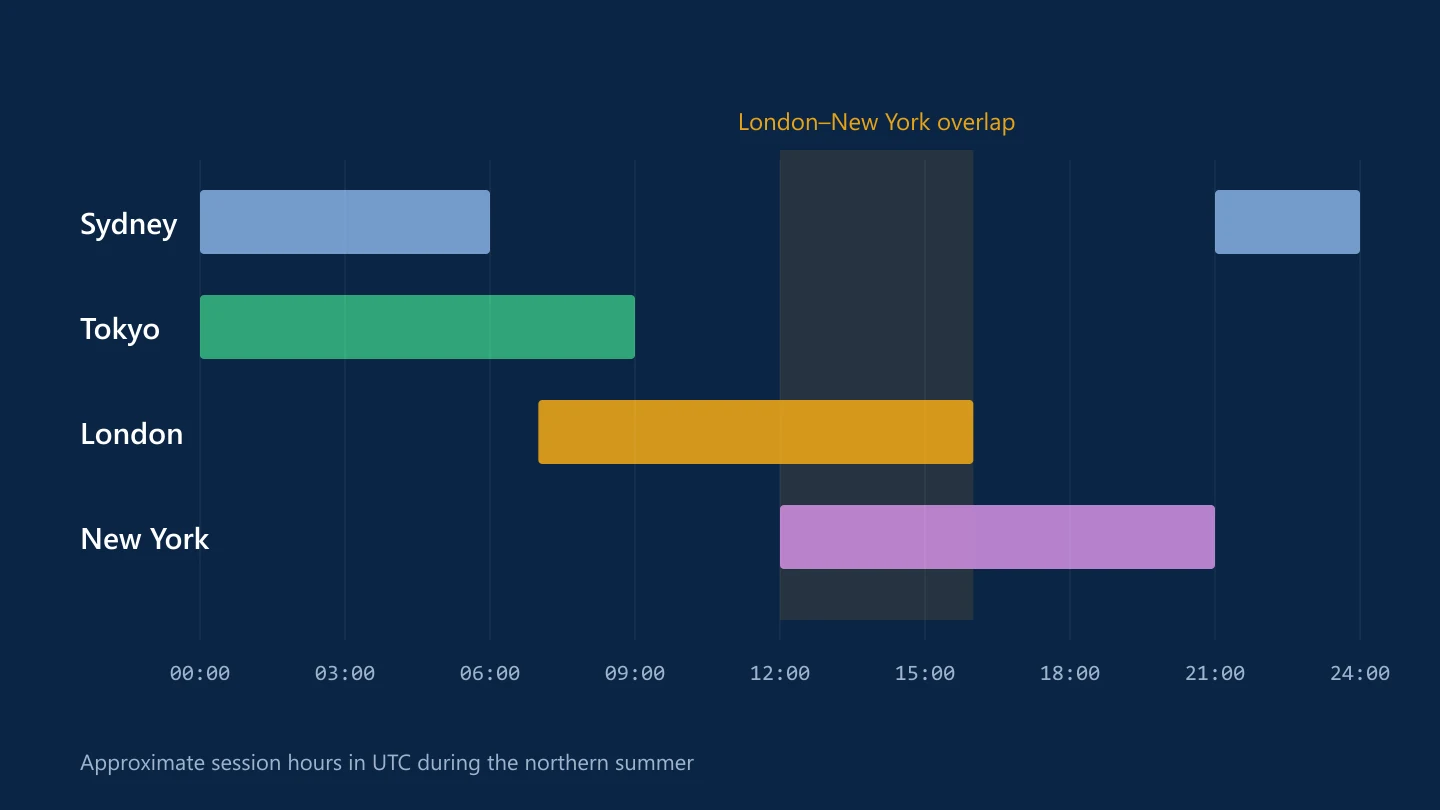
Currencies trade around the clock on weekdays, but not with the same liquidity. Session times in UTC, the overlaps that matter and the daylight-saving trap.
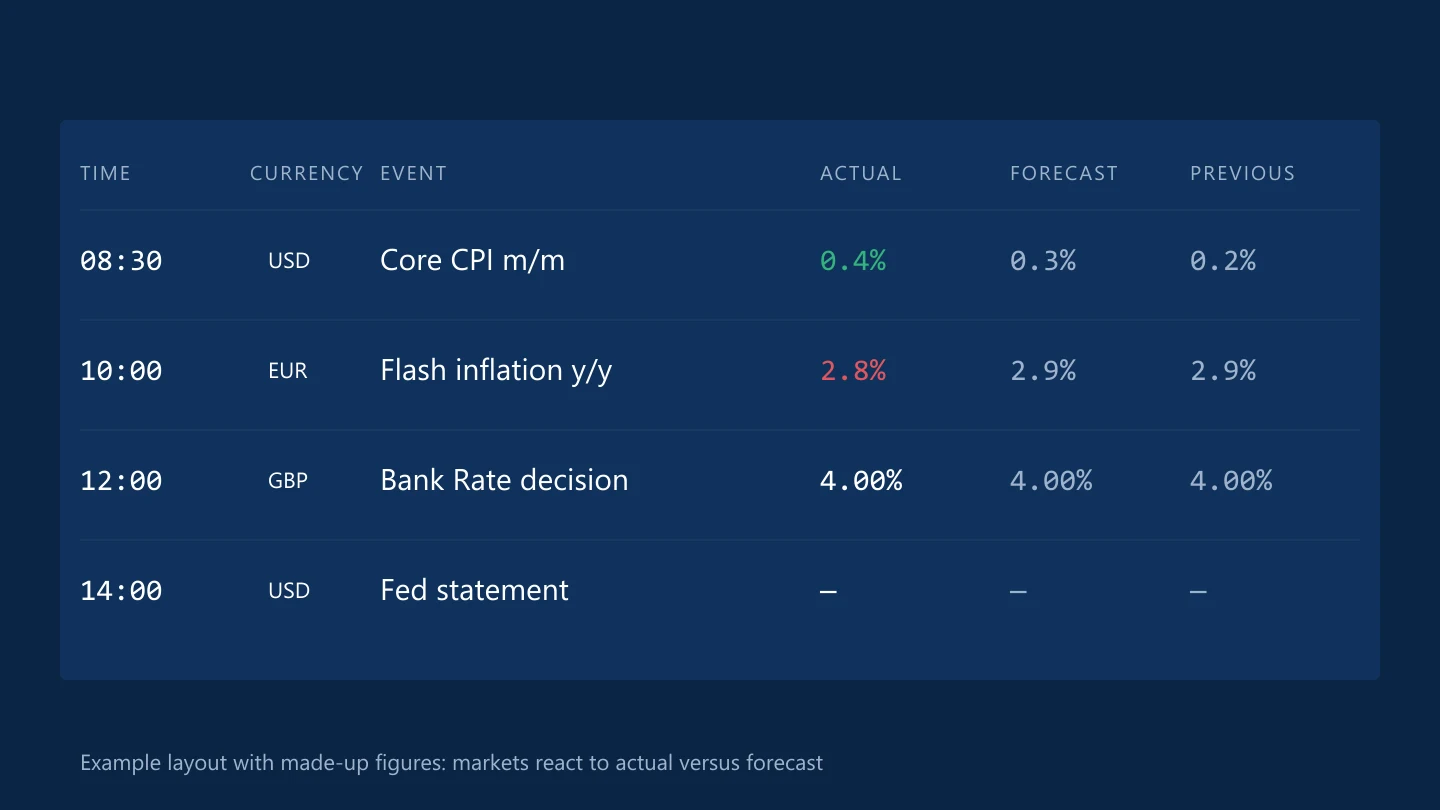
The economic calendar tells you when markets are likely to move. Here is what each column means and how traders use it to plan the week.
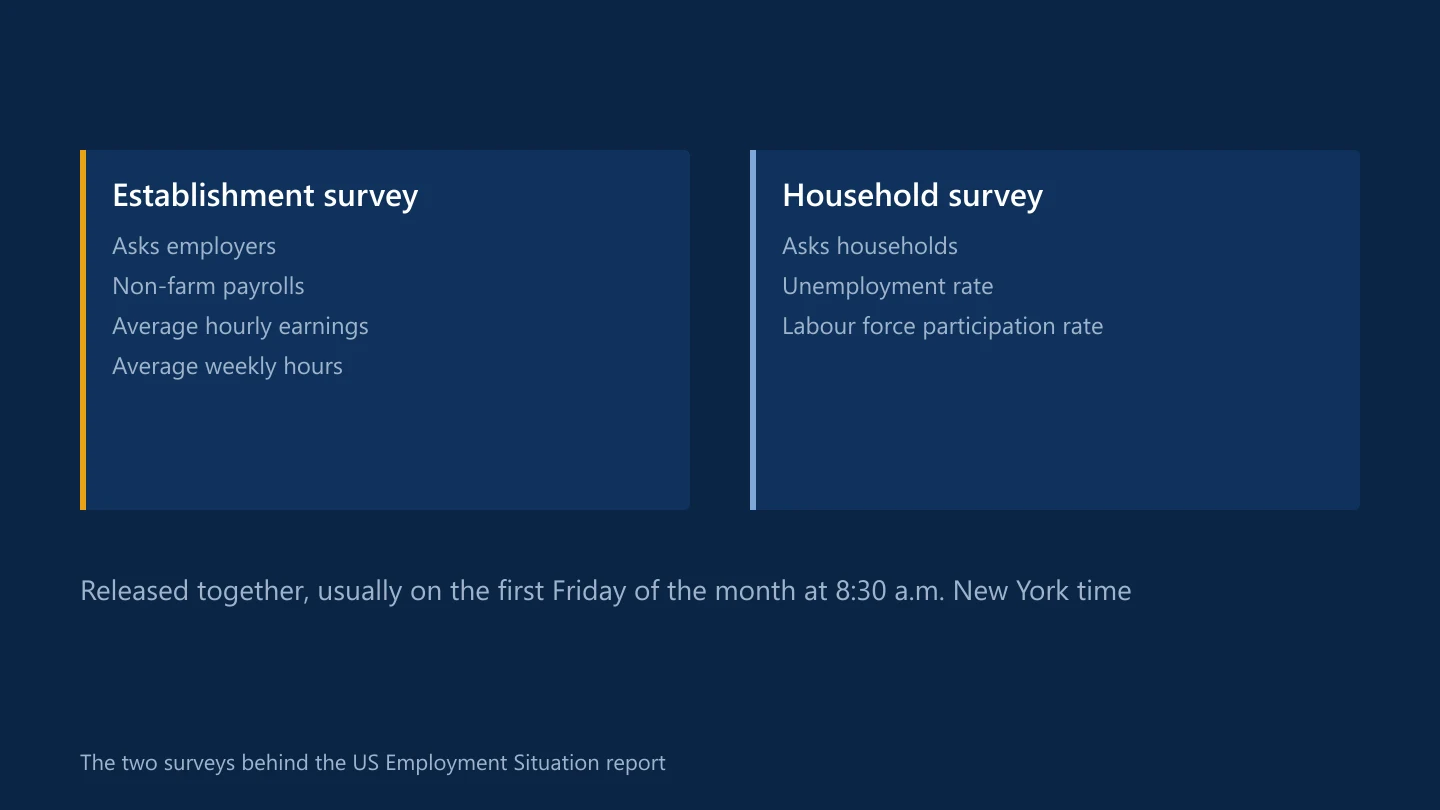
The monthly Employment Situation report is one of the most traded events in currency markets. What it measures, when it comes out and why the first move often fades.
The consumer price index is the inflation figure markets watch most closely. What it measures, why core CPI matters and how it links to interest rates.
Central bank decisions are the biggest scheduled events in forex. Why rates matter, why a hike can weaken a currency, and what to read beyond the decision.
Four times a year Fed officials publish where they think interest rates are heading. How to read the dot plot, and why it can move the dollar more than the decision.
Gold pays no interest and has no earnings, so its price responds to a different set of forces than currencies or shares. The main drivers behind XAU/USD.
Crude oil links energy markets to currencies through trade, inflation and interest rates. How that works for the Canadian dollar, and why the link isn't fixed.
When markets panic, money flows into a few currencies seen as safe. Why the yen, franc and dollar play that role, and when it breaks down.
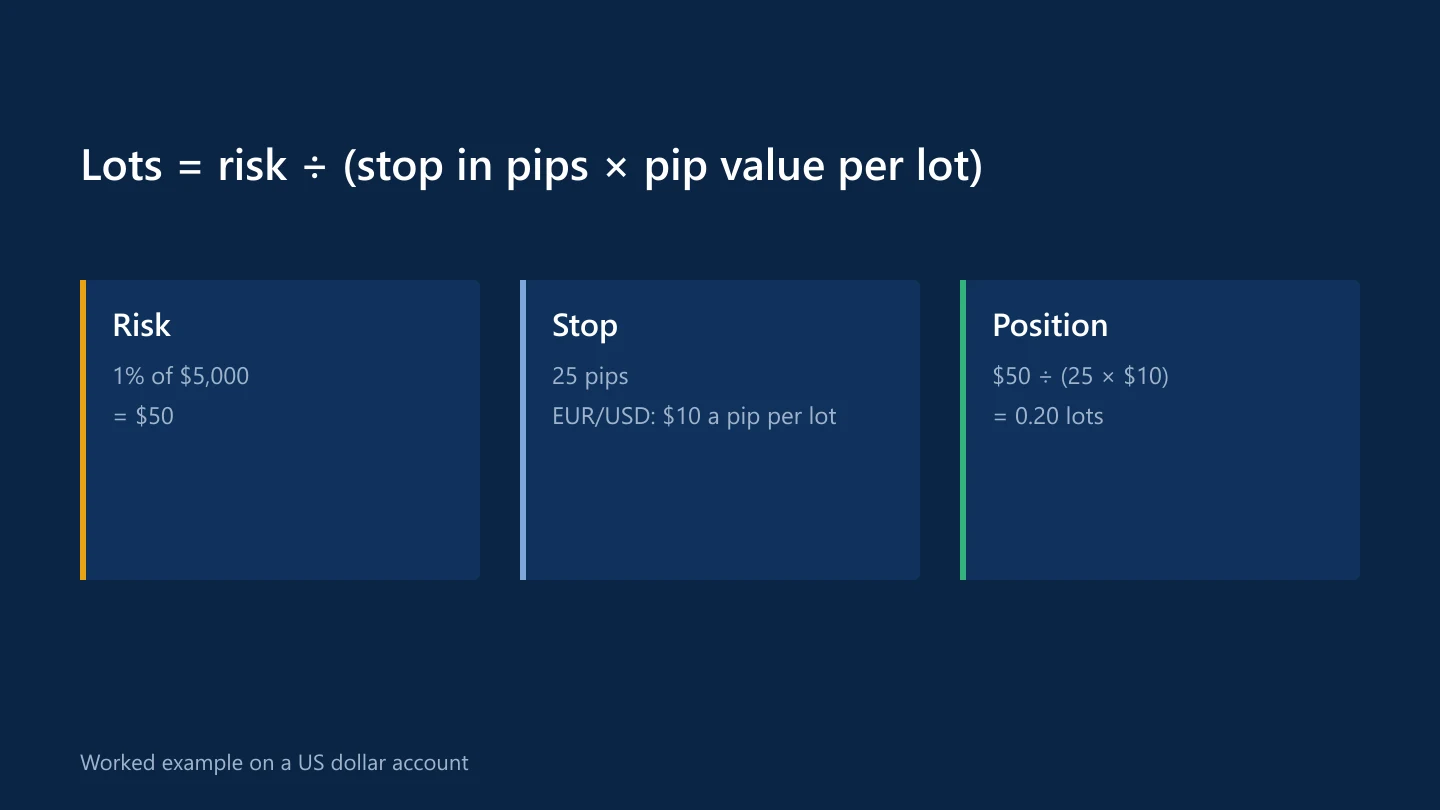
How much you trade matters more than where you enter. A step-by-step method for sizing positions from your stop-loss and the amount you are willing to lose.
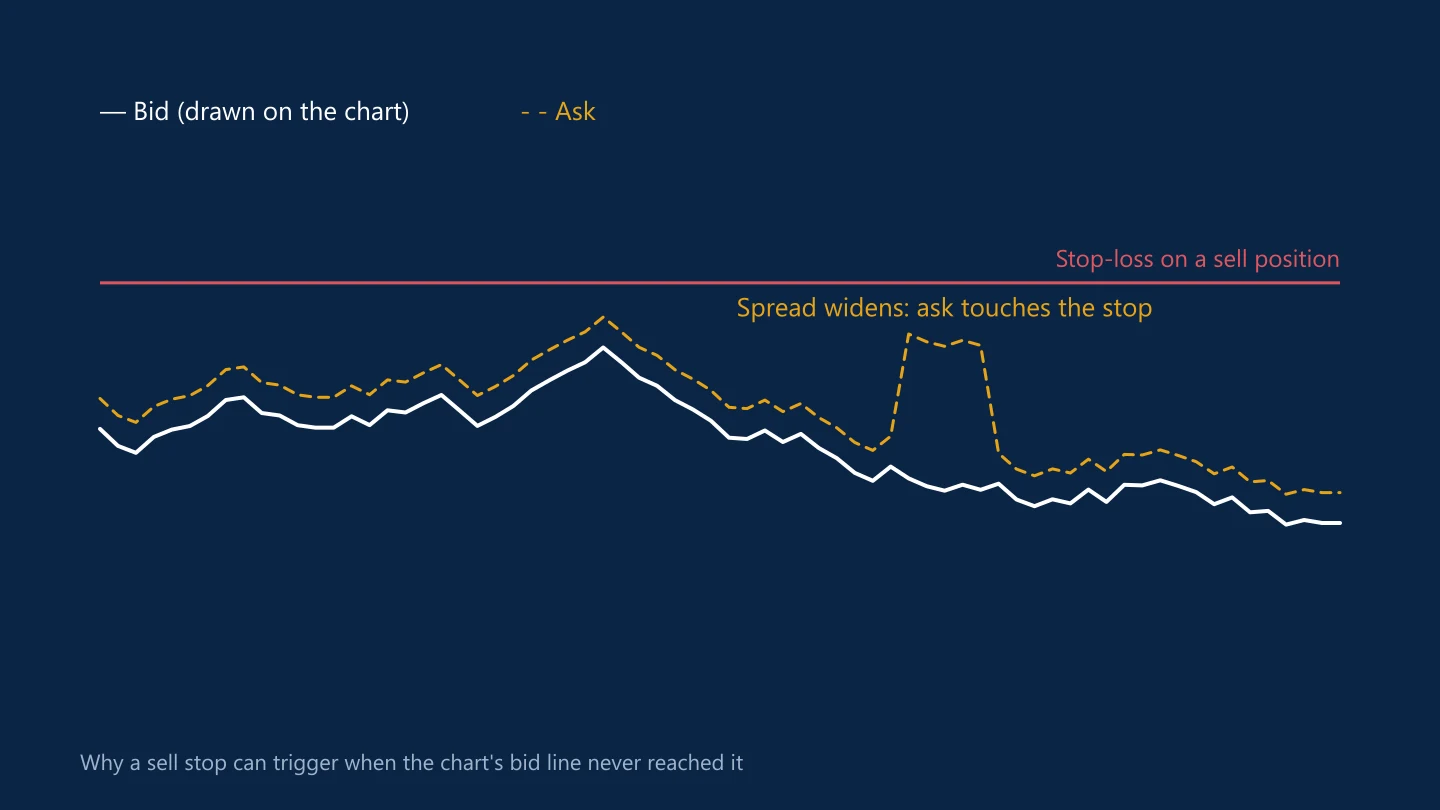
Why buy trades open at one price and close at another, why a stop can trigger when the chart never touched it, and how slippage happens.
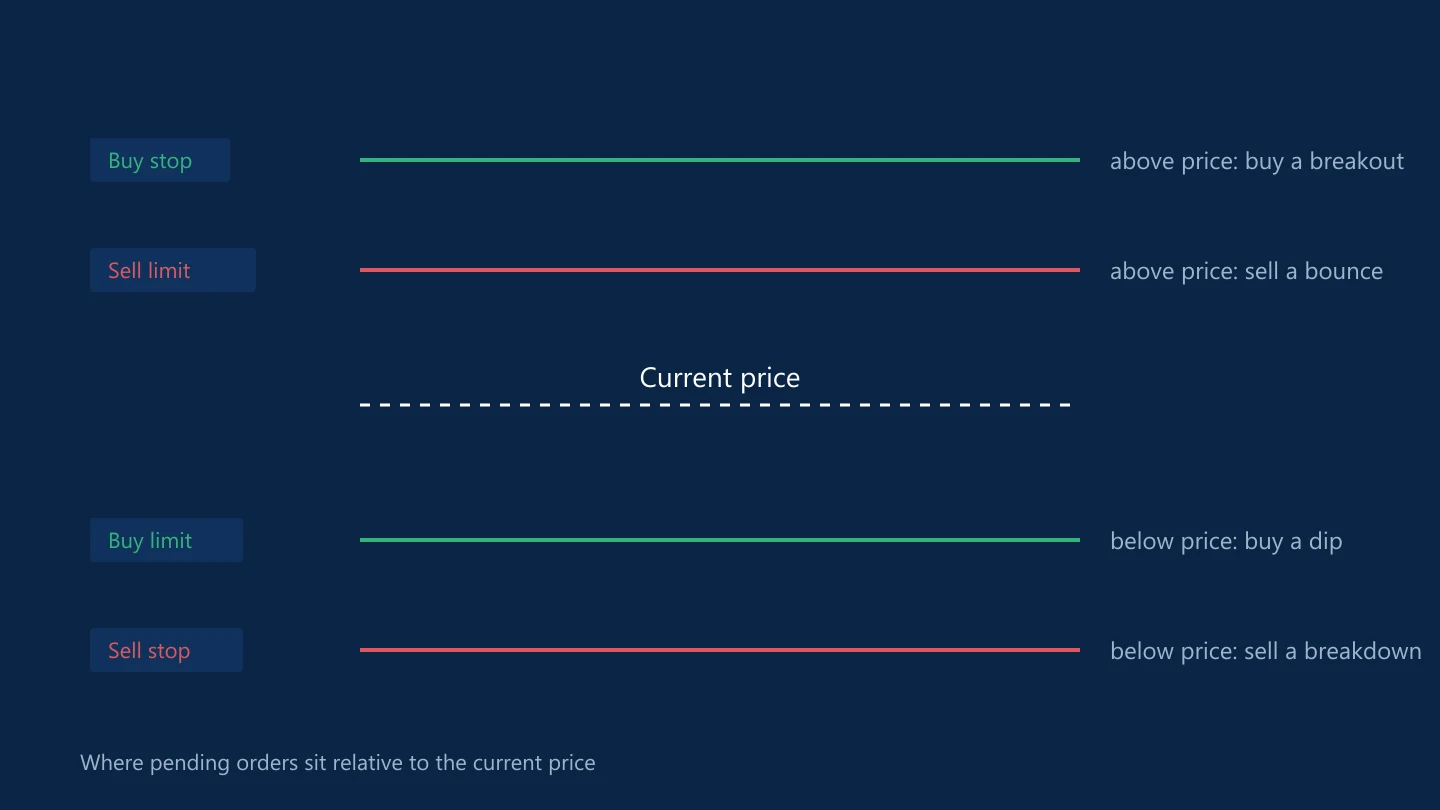
The order types on a trading platform decide when and at what price you enter or exit. What each one does, and the mistakes that cost traders money.
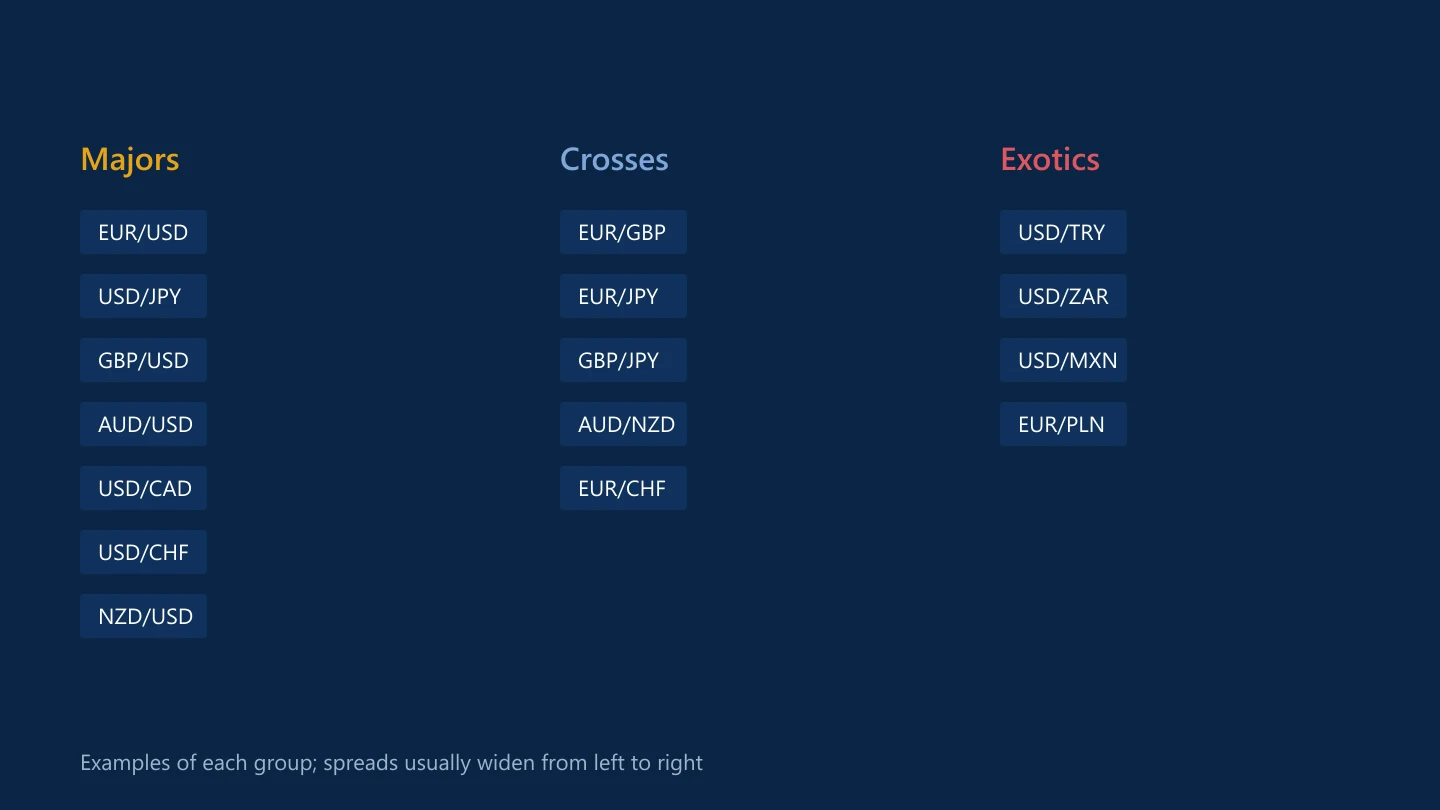
How to read a currency quote, which pairs count as majors, crosses and exotics, and why spreads and risks differ so much between them.
Borrowing in a low-interest currency to hold a high-interest one can earn steady income, until the exchange rate turns. How carry works and where the risk hides.
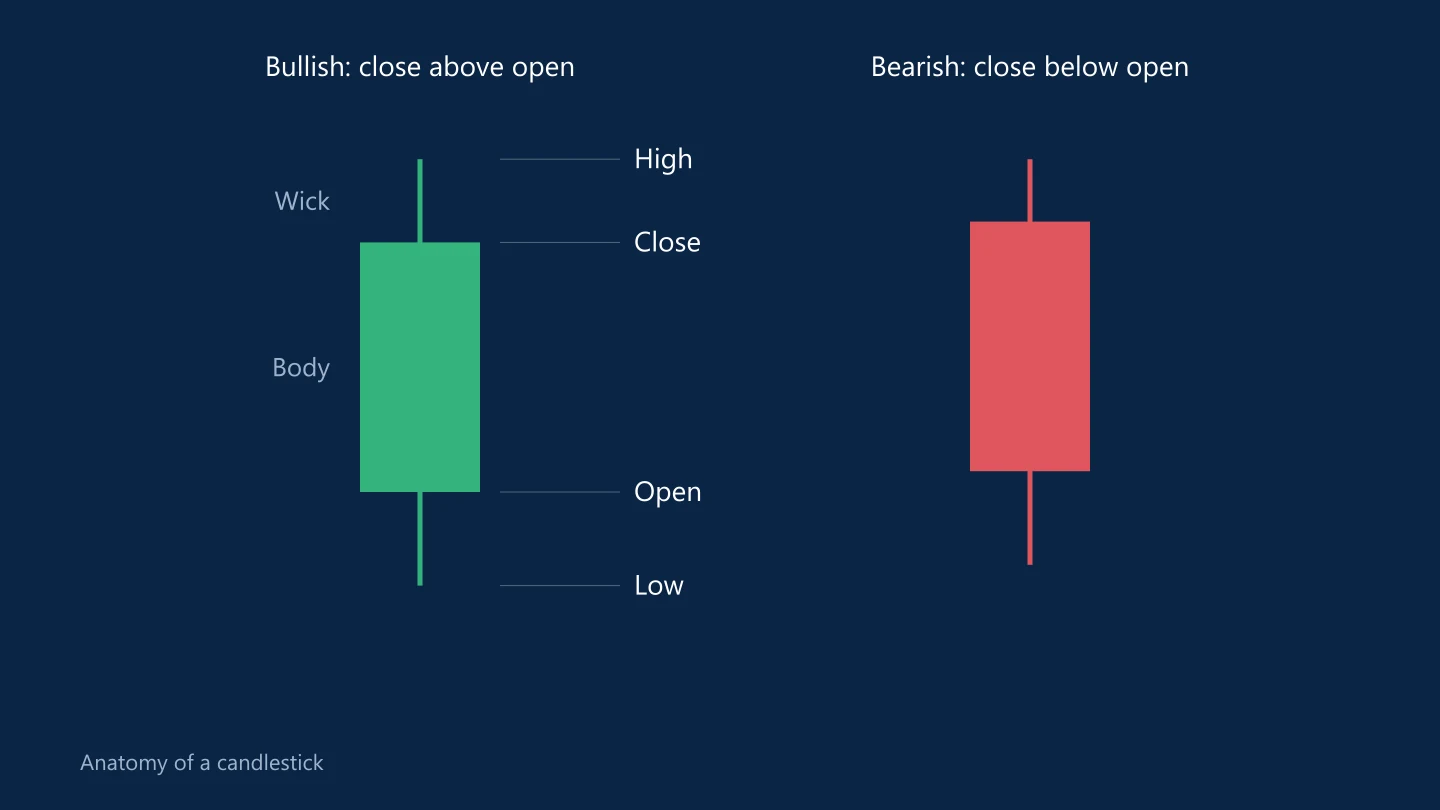
Candlesticks pack four prices into one shape. How to read the body and wicks, what timeframes mean and why single patterns are weaker than they look.