How to trade support and resistance levels properly
Support and resistance are the market's most used concepts and most misused lines. Here is how professionals draw them as zones, which touches count, and how to turn a level into a complete trade.
Every trader uses support and resistance. Almost nobody uses them well. The concept sounds simple — price turns at certain levels — but the practical questions are where the mistakes live: which levels are real, how wide a level actually is, which touches count, and what exactly you do when price reaches one.
This guide answers those questions step by step, and turns the market's oldest concept into a complete, tradeable structure. The conceptual background is in support and resistance levels explained; this guide is the execution manual.
Levels are zones, not lines
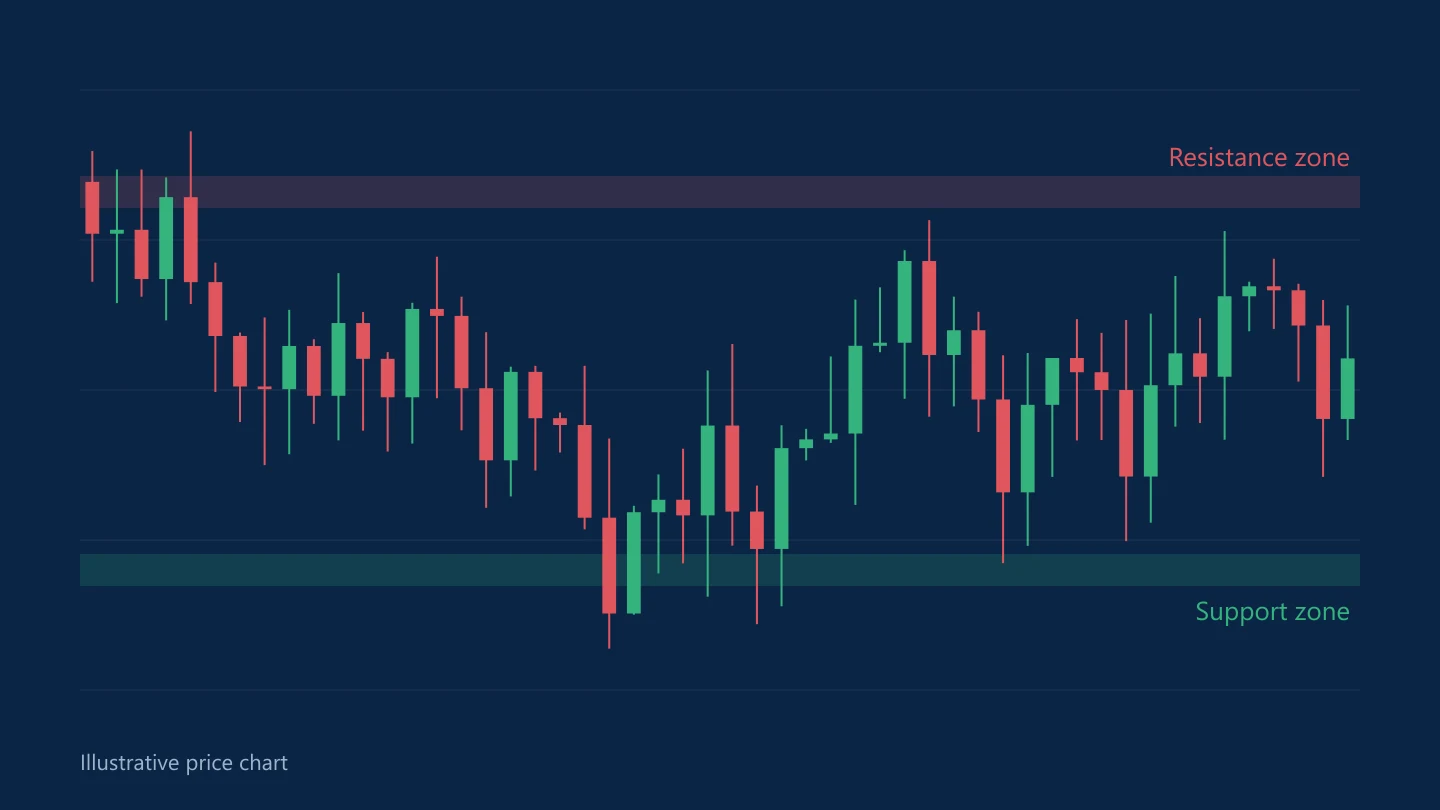
The first professional habit is to stop drawing lines. A level is not a single price; it is a zone — an area where price has reacted before, and where it is likely to react again. How wide the zone should be depends on the time frame and the pair's volatility: on a 15-minute chart a zone might be 5 pips wide; on the daily chart it might be 50. The ATR guide gives the volatility measure that makes zone width consistent instead of arbitrary.
Drawing zones instead of lines changes everything downstream: entries become ranges, stops get placed beyond the zone rather than at the line, and the endless arguments about whether price "broke" a level dissolve into a single question — did price close beyond the zone?

Which levels are real
Not all levels are equal. A level earns its place on the chart by its history, and the history has a hierarchy:
The number of touches. A level tested three times is more significant than one tested once. Each touch that holds adds evidence that real orders sit there.
The time frame. Levels from higher time frames — the daily chart's highs and lows, the weekly pivots — dominate everything drawn below them. A 4-hour level that conflicts with a daily level is usually noise.
The reaction's quality. A level where price turned sharply, with strong rejection candles, matters more than one where price drifted through slowly.
The confluence. A level that coincides with a round number, a trend line, a moving average or a Fibonacci level is stronger than one standing alone. The trend lines guide covers how these structures combine.
The practical habit: draw fewer levels, and require more of them. A chart with eight levels explains nothing; a chart with three well-earned ones does.
The flip: support becomes resistance
The single most useful dynamic in level trading is the flip. When price breaks below support, that level does not disappear — it changes role, and the broken support often acts as resistance on the next test. The same works upward: broken resistance becomes support. The mechanics are in support and resistance explained.
The flip is the engine behind the retest trade: break the level, wait for the return, and trade the rejection at the flipped level. It is the same structure as the breakout retest, seen from the level's side.

What to do when price reaches a level
Price arriving at a level is not a signal; it is an invitation to look for one. The signal comes from how price behaves there:
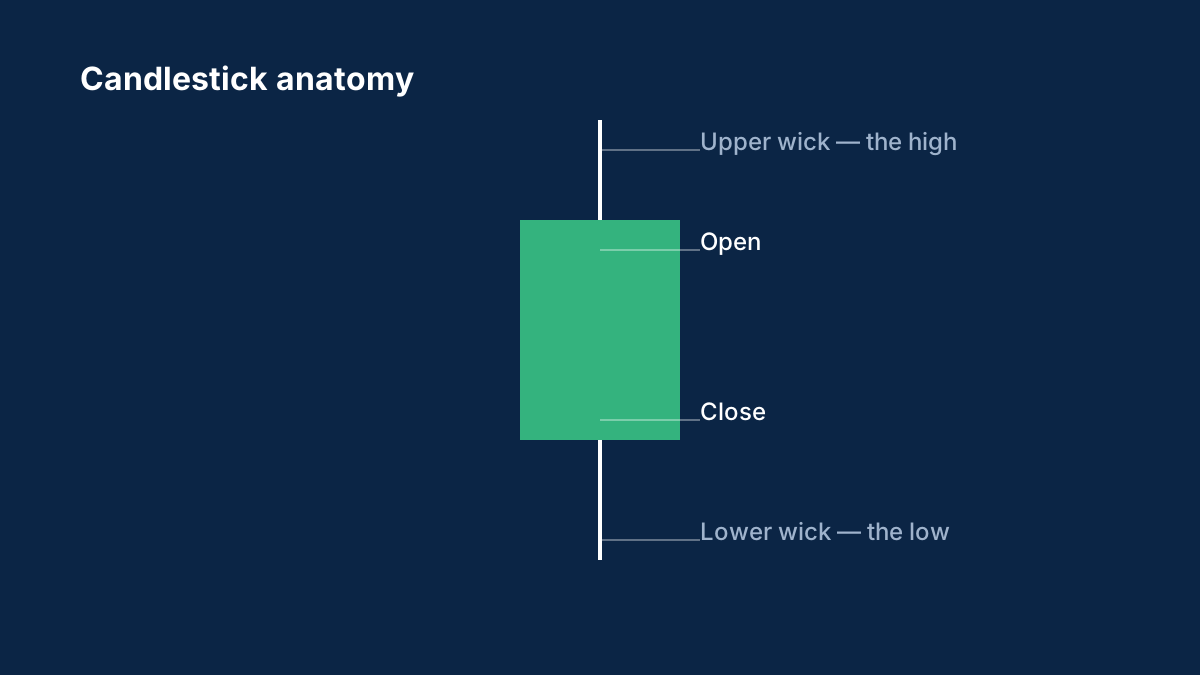
The rejection. Price touches the zone and leaves a wick, an engulfing candle or a failed break. That is the entry trigger for a bounce trade — trade the direction away from the level, stop beyond the zone, target the opposite side or the next level. Candlestick charts explained decodes the rejection signatures.
The break-and-retest. Price closes beyond the zone, returns, and the flipped level holds. That is the entry trigger for a breakout trade in the direction of the break.
The drift-through. Price passes through the zone without pausing. No trade. A level that does not react is not yet a level worth trading.
The discipline is to let the level's behaviour decide. The market will show you, within a few candles, which of the three scenarios it has chosen.
Stops and targets at levels
The stop's anchor is the zone, not the entry price. On a bounce trade, the stop sits beyond the zone's far edge — the point where the trade idea is simply wrong. On a break-and-retest, the stop sits beyond the retest's rejection. In both cases the stop distance is what the structure requires, and the position size is then calculated from that distance. Position sizing and risk per trade has the full arithmetic.
Targets work the same way. The first target is the next level in the direction of the trade; the second is the one after that. If the distance to the first target is less than the stop distance, the trade is not worth taking — the risk-reward guide explains why a level-based plan should refuse trades whose first target cannot at least match the risk.
The mistakes that define level trading
The classic mistakes are all variants of the same error — treating levels as certainties. Entering at the level without a trigger — the bounce that never came. Stops at the line instead of beyond the zone — the stop that dies of noise. Too many levels — the chart so full of lines that every trade has a level to justify it. And ignoring the higher time frame — trading a 15-minute level into the teeth of a daily trend.
The cure for all four is the same: fewer levels, wider zones, triggers before entries, and the higher time frame read before everything else.
Support and resistance are not a strategy by themselves; they are the frame every strategy hangs on. Drawn as zones, earned by history, traded on behaviour — they become the market's most reliable structure, and the foundation of every plan that works.
Sources
Common questions
How do you draw support and resistance properly?
As zones, not lines. Mark areas where price has reacted repeatedly, especially on higher time frames, and size the zone to the pair's volatility. Fewer, better-earned levels beat many thin lines.
What makes a support level strong?
Multiple touches that held, a higher time frame, a sharp rejection when price last arrived, and confluence with round numbers, trend lines or moving averages.
What happens when support breaks?
The level does not disappear — it flips. Broken support often acts as resistance on the next test, and the retest of the flipped level is one of the market's most tradeable patterns.
Should I enter exactly at a support level?
No. Wait for a trigger at the level — a rejection candle or a failed break — before entering. Entering at the level without a trigger is how traders buy every level on the way down.
Where do I place stops and targets at levels?
The stop goes beyond the zone's far edge, so it only fires when the trade idea is wrong. The first target is the next level in the trade's direction, and the trade is skipped if that target cannot at least match the risk.
This article is for information only and is not financial advice. Trading forex and CFDs carries a high risk of losing money. Read the risk warning. Spotted an error? Tell the editors.
Comments
Log in to join the discussion. Comments follow the community guidelines.
Log in to commentLoading comments…