Brent above $100: what it means for currencies
Brent has traded above $100 a barrel since early September as Hormuz shipping dwindles. Here is what triple-digit oil does to the commodity currencies, the importers and the inflation picture.
Brent crude has traded above $100 a barrel since early September, as shipping through the Strait of Hormuz dwindled (report) — the first sustained stretch above the triple-digit mark in this cycle. The level is not just a number: $100 oil rewires the currency market's energy channels, redistributing income toward the exporters, pressuring the importers, and feeding the inflation shock the central banks are now answering in public.
This analysis maps what $100 oil does to the currencies. The channels are in oil and the Canadian dollar and the oil and inflation explainer.
The exporters' support
The exporters get the terms-of-trade channel's direct support. Canada and Norway — the majors' two oil exporters — see their export revenues rise with the price, their trade balances improve, and their currencies strengthen on the channel. The support is real but conditional: it competes with the rate channel, and the two pull in opposite directions while the central banks weigh the same oil's inflation effect. The USD/CAD explainer maps the tug-of-war; the oil and CAD guide documents the correlation's strength and its breakdowns.
The practical read: CAD and NOK's support from $100 oil is strongest when their central banks are not simultaneously fighting the oil-fed inflation — and the current cycle is exactly the case where both forces are live at once. The BoC trade-off analysis and the Norges Bank analysis cover the two banks' answers.
The importers' pressure
The importers carry the mirror image. The euro area and Japan — the majors' large energy importers — see their import bills rise, their terms of trade deteriorate, and their currencies face the pressure the exporters' gain. The pressure runs through two channels: the direct trade effect, and the inflation effect, as the energy costs feed the price indices the central banks watch. The euro-area story and the BoJ's dilemma show the two importers' versions of the pressure.
The dollar's position is the middle case: the US is a large producer as well as consumer, so its terms-of-trade effect is muted — but the inflation channel runs through the Fed regardless, and the dollar trades the Fed's answer. The Fed hike analysis covers the dollar's side.
The inflation channel
The inflation channel is $100 oil's widest reach, because it touches every economy regardless of trade position. The chain is the oil and inflation explainer's core: fuel prices lift the headline CPI, the headline-core gap widens, and each central bank must judge whether the shock is transitory or feeding the second round. The September prints show the channel's work — the UK's 3.1% with motor fuels up 23% (report), the US's 3.4% with energy up 16.3% (report), Canada's 3.0% against 2.4% excluding gasoline (report).
The channel's currency effect runs through the rate paths: each bank's answer to the oil-fed inflation is a rate divergence, and the pairs trade the differences. The energy shock analysis maps the three banks' different answers to the same shock.
What sustains the price
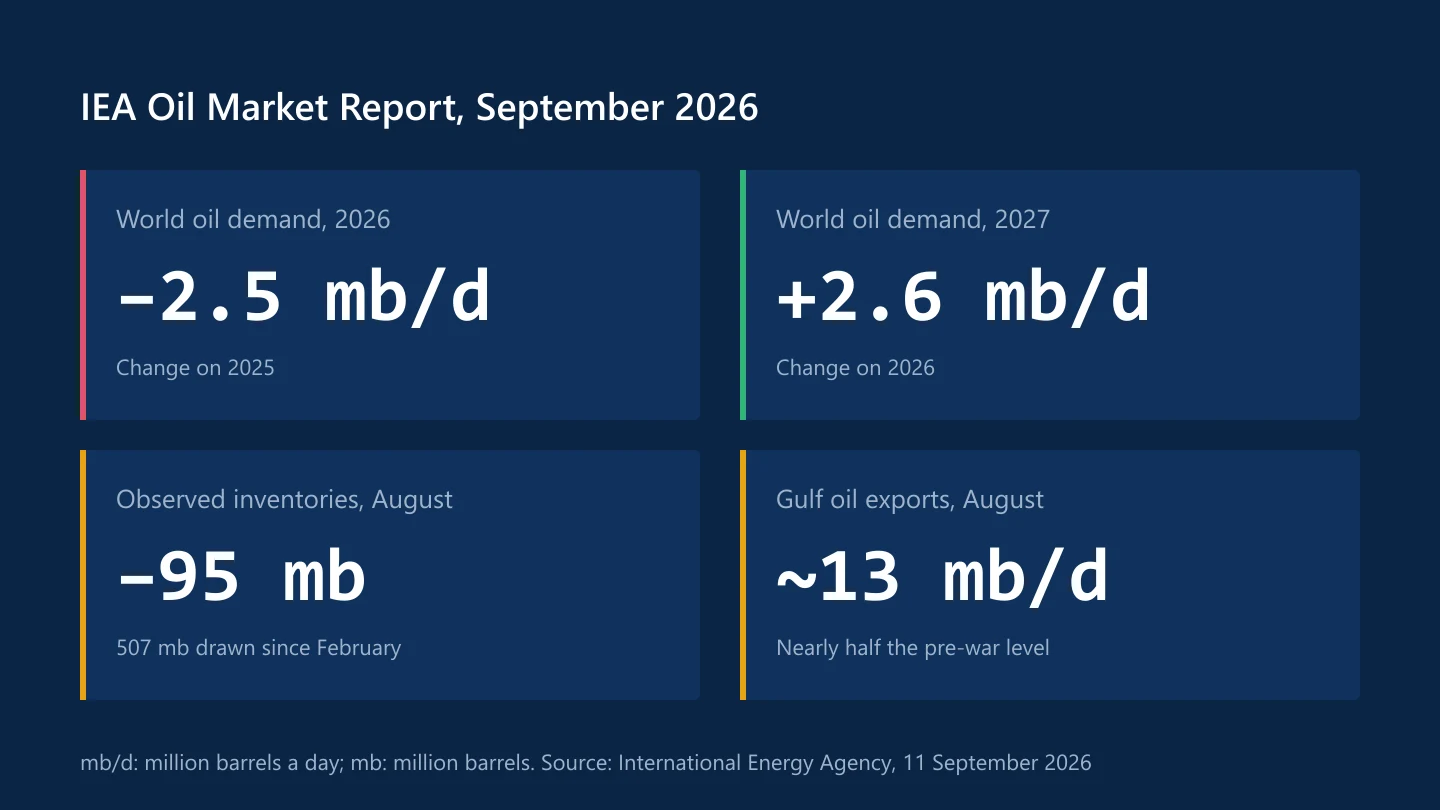
The $100 level's persistence depends on the supply story that produced it. The immediate driver is the Hormuz disruption — shipping through the strait has dwindled, squeezing the world's most important oil chokepoint (report). The longer-term backdrop is the demand picture, where the IEA's September report forecasts world demand falling in 2026 before recovering in 2027 (report) — a mixed picture in which the supply shock dominates the price while the demand trend argues against its persistence.
The practical read: the price's path depends on the chokepoint's resolution — a reopening of Hormuz shipping would pressure the price sharply, while a prolonged disruption sustains it. The oil calendar's supply headlines are the price's real catalysts, and the oil trading guide covers the calendar.
How to trade $100 oil
The practical read:
- Track the supply story first — the Hormuz disruption's resolution is the price's biggest catalyst, and the supply headlines lead the oil-sensitive currencies. The oil and CAD guide covers the channel's timing.
- Watch the two-channel net on CAD and NOK — the terms-of-trade support against the inflation pressure, with the central banks' answers deciding the balance. The USD/CAD explainer has the diagnostic.
- Weight the inflation channel everywhere — the headline-core gaps are the shock's fingerprints, and the CPI guide supplies the reading.
- Expect the rate-path divergence — each central bank's answer to the oil-fed inflation is a gap the pairs trade. The energy shock analysis maps the answers.

The supply story's anatomy
The price's supply story deserves its full anatomy, because the Hormuz disruption is the market's most concentrated supply risk. The Strait of Hormuz carries a large share of the world's seaborne oil, and the shipping's dwindling (report) squeezes the chokepoint the market prices as its worst-case supply scenario. The anatomy's layers: the physical flow — the barrels that must transit the strait; the insurance and freight costs — the premiums that rise with the risk; and the expectation channel — the market pricing the disruption's persistence before the barrels' actual shortfall. The oil trading guide covers the supply side's mechanics; the Hormuz case is the guide's worst-case chapter, live.
The anatomy's practical read is the price's asymmetry: the supply shock's resolution — a reopening of the chokepoint — would pressure the price sharply, while its persistence sustains the premium. The market's daily pricing of the two outcomes is the oil price's story, and the supply headlines are its catalysts. The oil and inflation explainer covers the shock's pass-through into the currencies' inflation channels.
The demand side's counterweight
The supply shock's counterweight is the demand picture, and the IEA's September report supplies it: world oil demand is forecast to fall in 2026 before recovering in 2027 (report). The demand forecast's role is the price's longer anchor: the supply shock sets the near-term premium, and the demand trend argues against its persistence — a market where the barrels' shortage is real but the consumption's growth is not. The two forces' balance is the price's medium-term question, and the monthly reports' revisions are the balance's updates. The oil trading guide covers reading the monthly reports; the demand side's current read is the guide's cautionary chapter — the premium's persistence is not guaranteed by the shock alone.
The demand side's currency meaning runs through the growth channel: softer demand expectations are softer global growth expectations, and the commodity currencies' growth legs feel the revision. The commodity currencies guide covers the channel; the demand forecast's direction is the aussie's and the loonie's growth-side input.
The pair-level effects, in detail
The $100 oil's pair-level effects deserve the full map. USD/CAD trades the two-channel net — the terms-of-trade support against the rate gap's dollar pull — with the BoC's own trade-off (deliberations) as the policy overlay; the USD/CAD explainer covers the tug-of-war's daily read. The krone runs the same two channels with the largest oil share, per the Norges Bank analysis. The importers — the euro and the yen — carry the terms-of-trade pressure, with the BoJ dilemma analysis covering the yen's version. And every pair carries the inflation channel's second-order effect, as each central bank's answer to the oil-fed inflation becomes a rate-path divergence — the energy shock analysis maps the banks' answers.
The pair map's practical rule is the channel matching: the trader's pair choice is a channel choice, and the oil story's trade is the pair whose channel the price moved most. The oil and CAD guide supplies the exporter side's mechanics; the importer side's read runs through the inflation transmission explainer.
The scenarios for the price
The $100 level's future resolves into three scenarios:
The persistence scenario. The Hormuz disruption continues, the supply premium holds, and the inflation channel keeps feeding the central banks' debates — the oil-sensitive currencies keep their two-channel tension, and the headline-core gaps stay wide. The scenario is the current baseline.
The resolution scenario. The chokepoint reopens, the supply premium deflates, and the energy shock fades — the headline-core gaps narrow, the central banks' transitory views vindicate, and the oil channels reverse together. The scenario is the shock's end, and the supply headlines are its trigger.
The escalation scenario. The disruption deepens, the price extends further, and the second round arrives in the inflation data — the central banks' patience fails, and the rate-path divergences widen. The scenario is the shock's compounding, and the wage data is its early warning.
The three scenarios' weights are the oil price and the oil-sensitive currencies' prices, and every supply headline and inflation print shifts them. The oil trading guide supplies the price-side framework; the energy shock analysis the inflation side's.
Brent above $100 is the currency market's clearest single-input shock: one price, three channels — the exporters' support, the importers' pressure and the inflation pass-through — and every major pair feels at least one. Read the supply story, the two-channel nets and the banks' answers, and triple-digit oil becomes the market's most legible force.
Sources
Common questions
Why is Brent above $100?
Shipping through the Strait of Hormuz has dwindled, squeezing the world's most important oil chokepoint. The supply shock has held Brent above $100 since early September.
Which currencies benefit from $100 oil?
The exporters — CAD and NOK — through the terms-of-trade channel. The support is strongest when their central banks are not simultaneously fighting the oil-fed inflation.
How does $100 oil reach every currency?
Through the inflation channel: fuel prices lift the headline CPI everywhere, each central bank must answer, and the answers become rate-path divergences the pairs trade.
What would push Brent back below $100?
The Hormuz disruption's resolution — a reopening of the chokepoint would pressure the price sharply. The demand side argues against persistence, but the supply story dominates while it lasts.
How should I trade the oil-sensitive pairs?
Watch the two-channel net on CAD and NOK — export support against inflation pressure — track the supply headlines for the price's path, and weight the central banks' answers.
This article is for information only and is not financial advice. Trading forex and CFDs carries a high risk of losing money. Read the risk warning. Spotted an error? Tell the editors.

Comments
Log in to join the discussion. Comments follow the community guidelines.
Log in to commentLoading comments…