How to read price action: candles, structure and context
Price action is the market's own language — candles, structure and levels, read in context. Here is how professionals read it, what the rejection signatures mean, and how to practise until it becomes instinct.
Price action is the market telling you what it is doing, in real time, without a single indicator on the chart. Every candle is a record of a struggle between buyers and sellers; every level is a memory of where the struggle turned. Traders who can read the language need nothing else. Traders who cannot, add indicators in the hope that mathematics will translate for them.
This guide teaches the language: the candles, the structure, the signatures of rejection and acceptance, and the practice routine that turns reading into instinct. The candle-by-candle basics are in how to read candlestick charts; this guide is about reading the story the candles tell together.
What a candle actually says
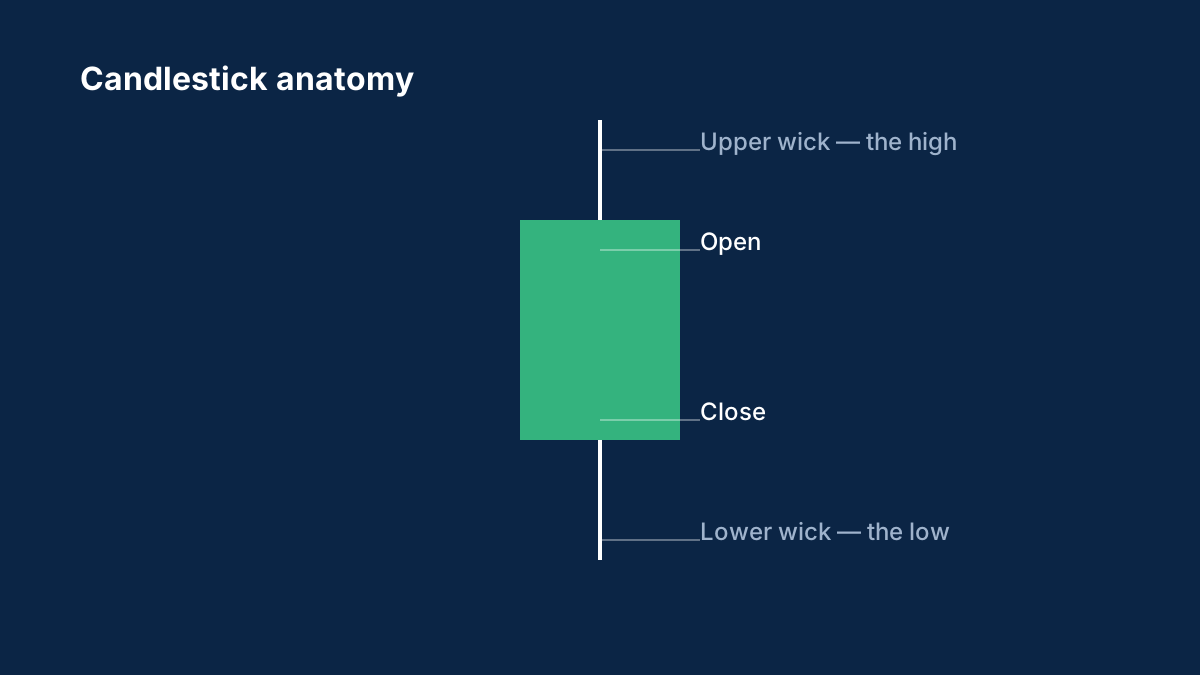
Each candle records four prices — open, high, low, close — and the relationship between them is the sentence. A candle with a small body and long lower wick says: sellers pushed price down, and buyers rejected it, closing near the open. A candle with a large body and small wicks says: one side controlled the entire session. The wicks are the failed attempts; the bodies are the accepted prices.
The professional read is always relative: the same candle means different things at a key level than it does in the middle of nowhere. A long wick at a support zone is a rejection worth noticing; the same wick mid-range is noise. Context — where the candle prints — decides the meaning. That single idea is most of what separates price-action trading from candlestick pattern memorisation.

The three readings that matter
Structure. The sequence of higher highs and higher lows, or the reverse, tells you who is in control and whether the control is strengthening or failing. Structure is the sentence; individual candles are the words. The trend lines guide formalises the same reading with drawn lines.
Levels. The zones where price has turned before are the market's memory. Price approaching a level is the setup; price's behaviour at the level is the signal. Support and resistance explained covers the zones and their hierarchy.
Momentum. The size and speed of the candles show the energy behind the move. Long-bodied candles moving away from a level mean conviction; shrinking candles near a level mean exhaustion. Momentum is the tone of voice — the same structure read with urgency or without it.
The rejection signatures
At a level, price does one of three things, and each has a signature:
The rejection. Price touches the level and leaves a wick — the longer the wick, the stronger the rejection. A hammer at support or a shooting star at resistance is the classic signature: the market tested the level, failed, and reversed. The signature is strongest when it appears at a level with history.
The acceptance. Price closes beyond the level with a full-bodied candle and does not return. The level has been accepted as broken, and the break becomes the new story.
The indecision. Small bodies, overlapping candles, no wicks of consequence — the market has not decided. Indecision is not a signal; it is a signal to wait.
The tradeable version of all three: wait for the signature, then act. The rejection at support is the long setup with the stop below the wick; the acceptance beyond resistance is the breakout setup with the stop below the break. The breakout guide covers the acceptance case in full.
Context beats patterns
The most common price-action mistake is pattern-hunting: spotting hammers, engulfing candles and inside bars everywhere, and trading each one. The professional read inverts the priority — context first, pattern second. An engulfing candle at a daily support zone with the higher-time-frame trend behind it is a trade; the same candle mid-range on a 15-minute chart is a coin flip.
The practical test: before any pattern-based entry, write down the context that justifies it — the level, the trend, the session. If the context sentence cannot be written, the pattern is not a trade. The journal guide makes this test a habit.
Reading across time frames
Price action is fractal: the same structures appear on every time frame, with different meaning. The professional routine reads top-down — the higher time frame sets the bias, the trading time frame finds the setup, and the entry is timed on the lower time frame's signature. A daily uptrend, a 4-hour pullback to support, a 15-minute rejection wick at that support: three time frames, one trade, and each reading confirms the others.
The discipline is the order. Reading bottom-up — finding a 5-minute pattern and then looking for a time frame to justify it — is how traders construct elaborate cases for trades the market never offered.
How to practise
Price-action reading is a skill built like any other: deliberate practice with feedback. The routine that works:
- Pick one pair, one time frame, one month of history.
- Scroll back candle by candle, hiding the future, and read what the market is doing at each point — structure, levels, momentum.
- Note where you would act, then reveal the next candles and grade the read.
- Journal the misses: what did the market show that you misread?
A month of this routine builds the pattern recognition no amount of reading can replace. The demo trading guide extends the same practice forward in real time.
Price action is not a strategy by itself — it is the literacy that every strategy depends on. Learn to read the candles in context, at the levels that matter, and every other tool in trading becomes optional. The market is always speaking; the skill is in the listening.
Sources
Common questions
What is price action trading?
Trading from the candles, structure and levels themselves — without indicators. Each candle records the struggle between buyers and sellers, and the trader reads the story in context.
What is a rejection candle?
A candle with a long wick that shows price tested a level and was pushed back — a hammer at support or a shooting star at resistance. The signature is meaningful at levels with history, not mid-range.
Do professional traders use indicators?
Many use none, or one at most. Price action is the shared foundation; indicators are optional overlays. The reading order is always context first, then any indicator's confirmation.
How do I learn to read price action?
Deliberate practice: scroll back through history candle by candle, read the market at each point without seeing the future, then reveal and grade the read. A month of this builds the pattern recognition.
Which time frame is best for price action?
Read top-down: the higher time frame for bias, the trading time frame for setups, the lower time frame for the entry signature. The order matters more than any single time frame's choice.
This article is for information only and is not financial advice. Trading forex and CFDs carries a high risk of losing money. Read the risk warning. Spotted an error? Tell the editors.

Comments
Log in to join the discussion. Comments follow the community guidelines.
Log in to commentLoading comments…