How to trade Bollinger Bands: squeezes, touches and rides
Bollinger Bands measure how stretched price is — and stretched markets can stretch further. Here is what the bands actually show, when to fade the touch and when to ride it, and how to trade the squeeze.
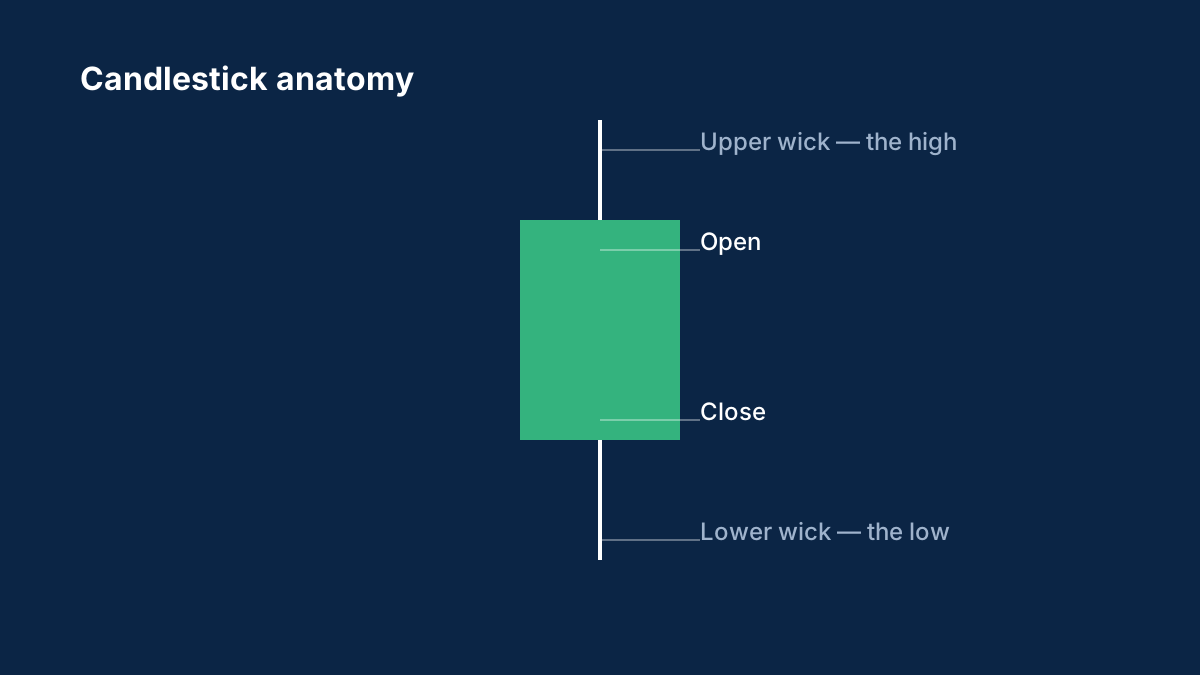
Bollinger Bands are the visual form of a statistical question: how far is price from its recent average, measured in standard deviations? The bands draw that distance — the middle band is a moving average, the outer bands sit two standard deviations away — and the chart becomes a map of stretch and squeeze. The bands' signals are famously tempting and famously ambiguous: a touch of the outer band can mean exhaustion or momentum, and telling the two apart is the entire skill.
This guide explains what the bands actually measure, the three classic trades — the fade, the ride and the squeeze — and the regime question that decides between them. The construction is in Bollinger Bands explained; this guide is the trading application.
What the bands actually show
The bands answer one question: is price unusually far from its recent average? The middle band is a moving average — conventionally 20 periods; the outer bands sit two standard deviations from it, a distance that expands and contracts with volatility. About 95% of closes sit inside the bands when price is behaving statistically normally — which means a close outside them is genuinely unusual, and the market is either breaking or overstretched.
That statistical framing is the bands' value and their trap. The bands describe the recent past, not the future: an unusual close can mean a reversal is near, or that the regime changed and the market will now trade outside the old bands for weeks. The bands cannot tell you which — the trader's context must. The Bollinger guide covers the statistics in detail.
The three trades
The fade at the band. The classic mean-reversion trade: price touches the outer band, the trader fades it back toward the middle band. The logic is reversion to the average, and it works best in ranges, where price cycles between the bands predictably. The entry needs the same confirmation as any fade — a rejection candle at the touch, not the touch itself — and the stop sits beyond the band's extreme. The range guide supplies the range context the fade requires.
The ride along the band. The momentum trade: price walks the outer band in a strong trend, and the trader rides it rather than fading it. The logic is that in trends, the bands' extremes are the trend's path, not its exhaustion — and fading them is trading against the move. The ride's confirmation is the band itself: price staying outside or along the band, pullbacks holding the middle band, and the trend structure intact. The trend guide has the structure rules.

The squeeze. The bands' signature setup: the distance between the outer bands compresses to its narrowest — volatility has collapsed — and the market is loading a spring. The squeeze does not predict direction; it predicts expansion, and the trade is the break of the squeeze's range in either direction, with the stop on the other side. The squeeze's classic failure is the false break, and the standard defence is the same as every breakout: wait for the retest or the confirmed close beyond the range. The breakout guide has the confirmation rules.
The regime question
The fade and the ride are opposite trades on the same signal, and the regime decides which applies. The question to answer before either: is the market ranging or trending?
In a range — the bands roughly horizontal, price cycling between them — the fade is the trade, and the ride is a trap. In a trend — the bands sloping, price walking one of them — the ride is the trade, and the fade is the counter-trend mistake. The regime read is the same structure question the multi-time-frame guide answers on the higher frame: the band trades inherit the higher frame's answer.
Settings and time frames
The standard settings — 20 periods, two standard deviations — are standard for good reason, and the practical rule is the usual one: pick a setting, standardise it, and test changes rather than switching. The time frame matters more: the bands' signals on the daily chart describe genuine volatility regimes; on the 5-minute chart they describe noise, and the fades there are spread-fodder. The bands work best on the time frame that matches the holding period, read alongside the higher frame's regime.
The mistakes to avoid
The band trader's classic errors are all variants of one: acting on the bands without the regime. Fading the band in a trend — selling strength that walks the band for weeks. Riding the band in a range — buying the top of the cycle that reversion is about to punish. Trading the squeeze's first break — buying the false break that the squeeze produces most often. Each is fixed by the same discipline: read the regime first, then choose the trade — fade in ranges, ride in trends, and let the squeeze's break prove itself before committing.
Bollinger Bands are a volatility map, and the map only helps if you know which terrain you are in. Read the regime, choose the trade that fits it, and the bands' statistical clarity becomes a trading edge instead of a trap.
Sources
Common questions
What do Bollinger Bands actually measure?
How far price is from its recent average, in standard deviations. The middle band is a 20-period average and the outer bands sit two standard deviations away — a map of stretch and squeeze.
Should I fade a touch of the Bollinger Band?
Only in a range. The fade works when price cycles between the bands; in a trend, the touch is the trend's path and the fade is a counter-trend mistake.
What is the Bollinger squeeze?
The bands compressing to their narrowest as volatility collapses. The squeeze predicts expansion, not direction — the trade is the break of the squeeze's range, with confirmation, in either direction.
Why does price walk the outer band in trends?
Because in a strong trend, price stays unusually far from its average for long stretches — the bands slope and price rides them. Fading the ride means trading against the move.
What time frame is best for Bollinger Bands?
The one matching the holding period, read alongside the higher frame's regime. Daily bands describe real volatility regimes; 5-minute bands describe noise, and their fades are spread-fodder.
This article is for information only and is not financial advice. Trading forex and CFDs carries a high risk of losing money. Read the risk warning. Spotted an error? Tell the editors.

Comments
Log in to join the discussion. Comments follow the community guidelines.
Log in to commentLoading comments…