What moves USD/JPY? Yields, the BoJ and intervention
USD/JPY is the pair where US yields meet the Bank of Japan — with the threat of intervention sitting over both. Here is the three-force driver map and how they take turns leading.
USD/JPY is the market's cleanest three-force pair. US yields pull it one way, the Bank of Japan's normalisation pulls it the other, and the threat of intervention — the authorities' unannounced buying of yen — hangs over both. The forces take turns leading, and the pair's behaviour changes completely depending on which one is active: a yield trade on calm days, a policy trade on BoJ days, and a tail-risk trade whenever intervention is in play.
This guide maps the three forces and how they interact. The trading framework is in the USD/JPY guide; this guide is the driver map behind it.
Force one: US yields
The pair's dominant driver is the US interest-rate story, transmitted through yields. The logic is the market's oldest: higher US yields make dollars more attractive relative to yen, and the pair rises; falling yields do the reverse. The 10-year Treasury yield is the pair's co-driver chart — USD/JPY and the 10-year move together so reliably that a divergence between them is a signal in itself. The 10-year yield explainer covers the yield leg in detail, and bond yields and exchange rates has the full mechanics.
The force's power is its constancy: every US data release and Fed event moves the pair through the yield channel, which is why the pair's most reliable trading days are US data days. The Fed hike explainer walks the transmission from decision to dollar.
Force two: the Bank of Japan
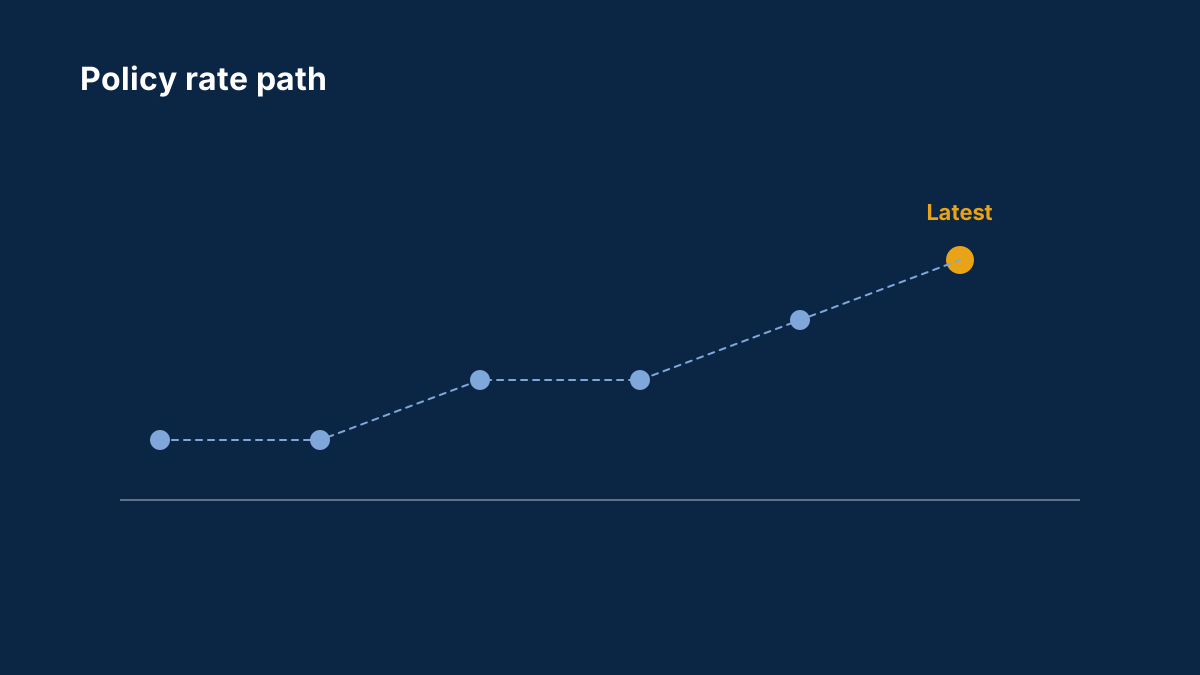
The yen's own story is the Bank of Japan's normalisation — the slow, deliberate exit from decades of near-zero policy. The BoJ holds its rate at 1.00% (preview), and every step — the rate, the pace, the communication — reprices the yen against the dollar's yield story. A hawkish BoJ surprise narrows the rate gap and sends the pair down; a dovish one widens the gap and lifts it.
The force's character is event-driven: the BoJ speaks less often than the Fed, and its decisions carry more surprise potential, because the bank has repeatedly moved faster than the market expected. BoJ days are the pair's sharpest scheduled events on the yen side. The central bank language explainer covers why the BoJ's phrasing matters as much as its rates.
Force three: intervention
The pair's third force is the one no other major carries: the risk that Japanese authorities buy yen to support it. The force is real and recent — Japan and the United States intervened jointly in 2026 (report) — and it operates without schedule or warning. Intervention's signature is a sudden, violent yen rally, hundreds of pips in minutes, designed to punish speculative positioning.
The force shapes the pair even when it is not firing. The threat of intervention caps the pair's rallies, because traders know the authorities can arrive at any level; the verbal warnings that precede action — officials describing moves as "excessive" or "speculative" — move the pair themselves; and the positioning crowd lives with a tail risk that shows up in how the pair trades around the BoJ's meetings. The intervention explainer covers when the tool succeeds and fails.
How the forces interact
The three forces rotate leadership, and the pair's behaviour follows:
Calm markets: yields lead. With no BoJ event and no intervention threat, the pair trades the US yield story like a pure rate-differential instrument. US data days are the pair's bread and butter.
BoJ days: the policy force leads. The yen side takes over, and the pair trades the gap between the two banks' paths. A hawkish surprise produces the pair's sharpest scheduled moves — down.
Intervention windows: the tail leads. When the authorities are active — warnings escalating, positioning crowded, the pair stretched — the intervention force overrides both others. The pair's rallies stall, its drops accelerate, and the range expands.
The trader's job is the same diagnostic as every multi-driver pair: name the active force before the session, and trade the pair it describes. The multi-driver reading in the EUR/USD explainer generalises the method.
The signatures to read
Each force has its fingerprint:
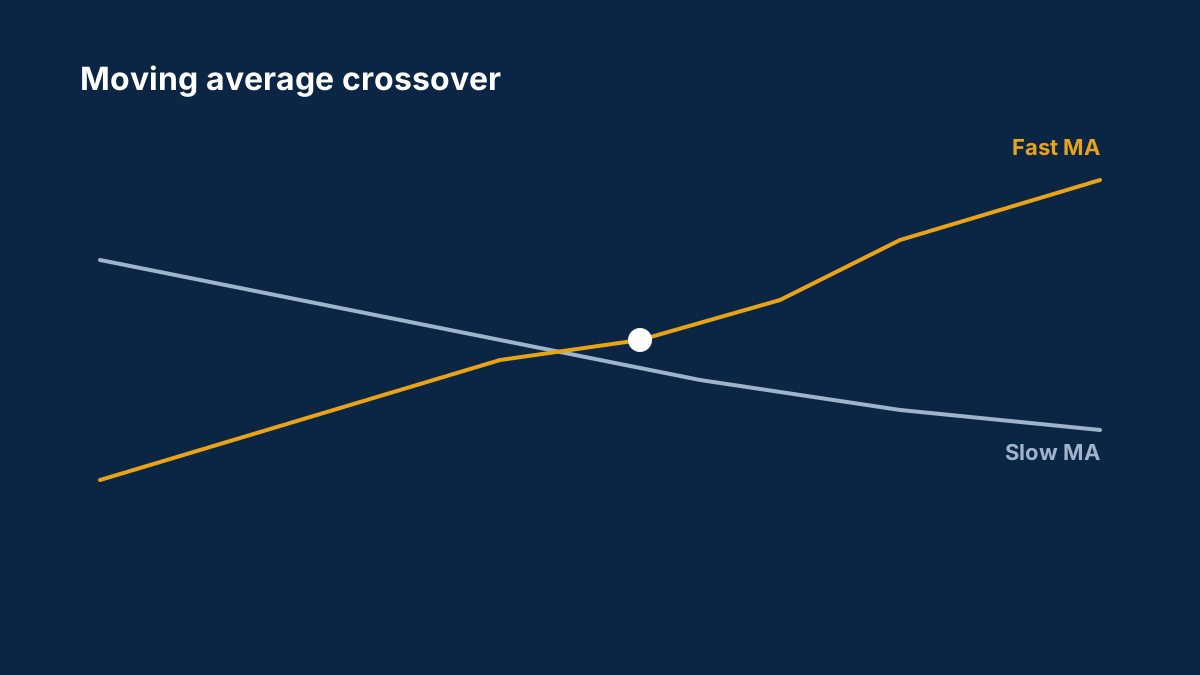
Yields leading: the pair and the 10-year Treasury moving together, day after day. The correlation is the tell — and its breakdown is the warning that another force is taking over.
The BoJ leading: the pair moving against the yield story — falling while yields are steady or rising. The divergence is the yen-side surprise's signature.
Intervention leading: the pair's rallies failing repeatedly at the same zone, verbal warnings escalating, and the drops coming in vertical bursts rather than orderly declines. The intervention report documents the pattern from this year's episode.

The practical read
The driver map compresses into a routine:
- Check the 10-year yield first — the pair's co-driver and its divergence alarm.
- Mark the BoJ calendar: decisions, speeches, and the Japanese data that feeds them.
- Track the verbal intervention ladder — the officials' escalating language is the early warning.
- Name the active force: yields, policy or intervention tail.
- Size for the force: normal size under yields, reduced under BoJ events, and tail-sized whenever intervention is live.
USD/JPY is three markets in one chart — the bond market, the BoJ and the authorities. Read the yields, watch the bank, respect the intervention risk, and the pair's three-force noise becomes a three-force map.
Sources
Common questions
What moves USD/JPY the most?
US yields lead on most days — the pair tracks the 10-year Treasury closely. The Bank of Japan's decisions move the yen side, and intervention risk overrides both whenever the authorities are active.
Why does USD/JPY follow the 10-year Treasury yield?
The yield is the market's read on US rates, and the pair trades the US-Japan rate gap. Higher US yields make dollars more attractive against yen, so the pair and the yield move together.
What is the verbal intervention ladder?
The escalating warnings officials issue before acting — calling moves excessive, speculative, then saying they are prepared to act. The ladder moves the pair itself and warns that actual intervention is near.
How do I know if the BoJ is driving the pair?
The pair diverges from the yield story — falling while yields are steady or rising. The divergence is the signature of a yen-side surprise.
How should I size USD/JPY positions?
By the active force: normal size when yields lead, reduced into BoJ events, and tail-sized whenever intervention warnings are live — the intervention move can be hundreds of pips in minutes.
This article is for information only and is not financial advice. Trading forex and CFDs carries a high risk of losing money. Read the risk warning. Spotted an error? Tell the editors.
Comments
Log in to join the discussion. Comments follow the community guidelines.
Log in to commentLoading comments…