News
Forex trading guides: page 3
Central bank decisions, economic data, gold and oil, and plain-English guides to how currency trading works. Every article links to its primary sources.
More articles
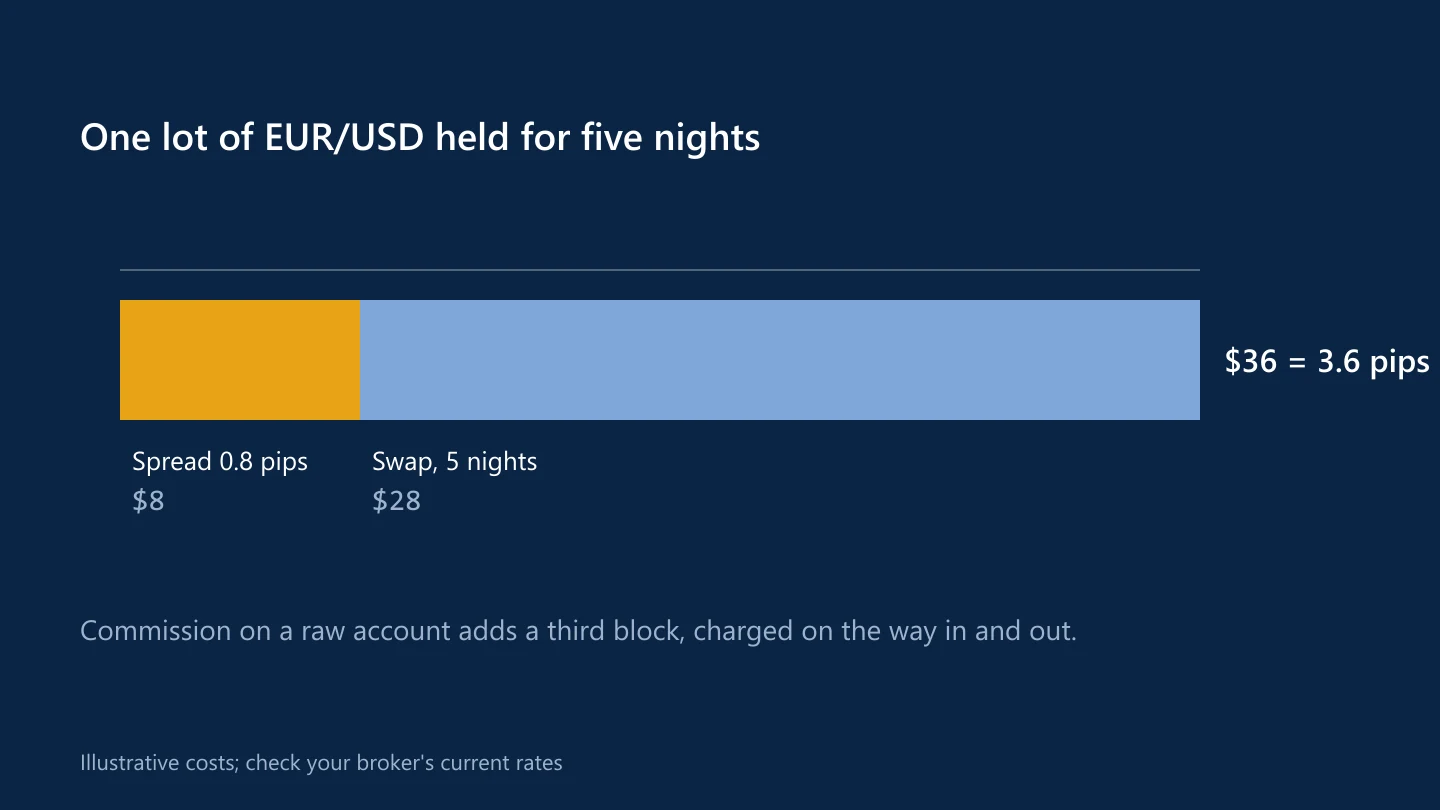
The real cost of a forex trade: spread, commission and swap
Every trade has costs, and they are easy to underestimate. Here is how to add up the spread, commission and overnight swap on a position.
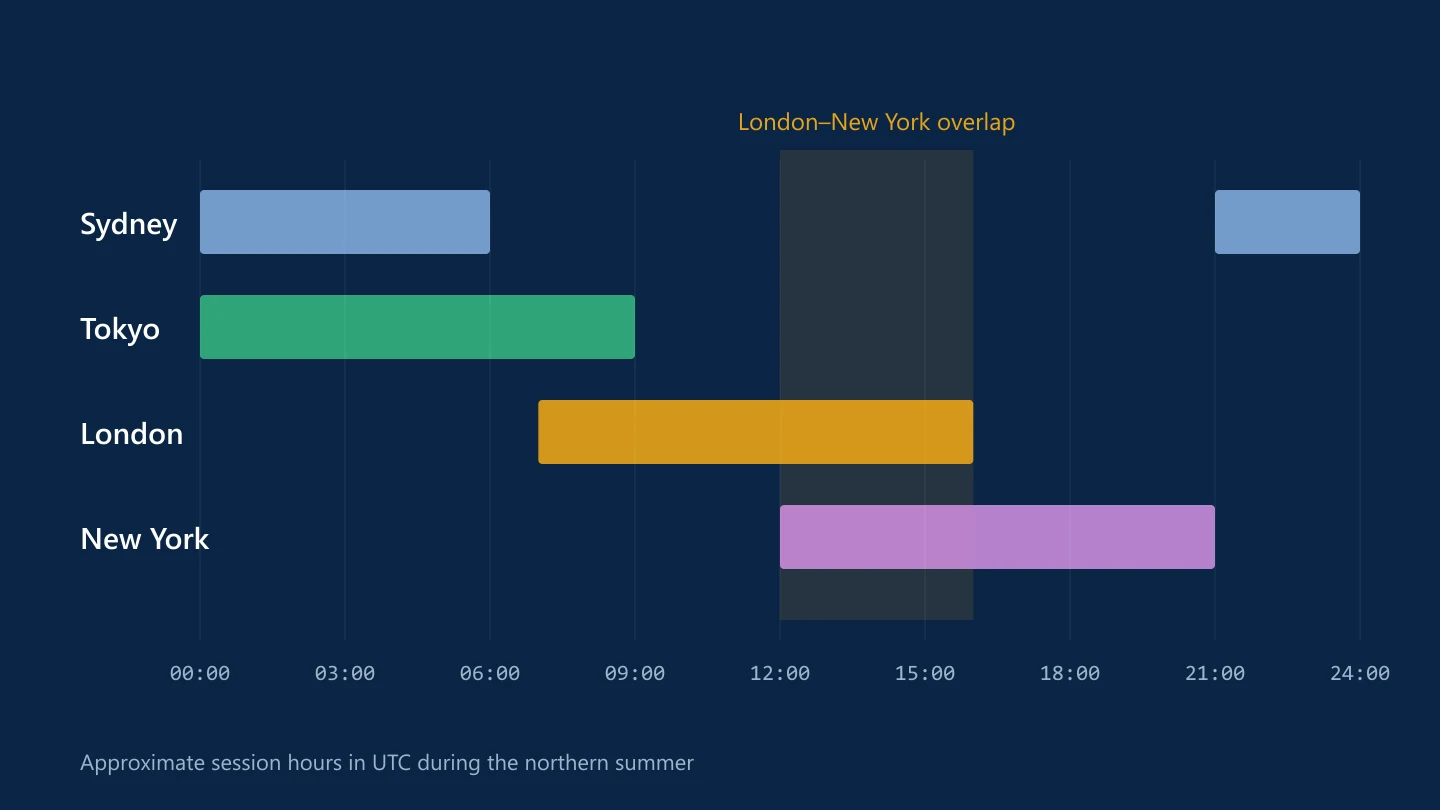
Forex market hours: the Sydney, Tokyo, London and New York sessions
Currencies trade around the clock on weekdays, but not with the same liquidity. Session times in UTC, the overlaps that matter and the daylight-saving trap.
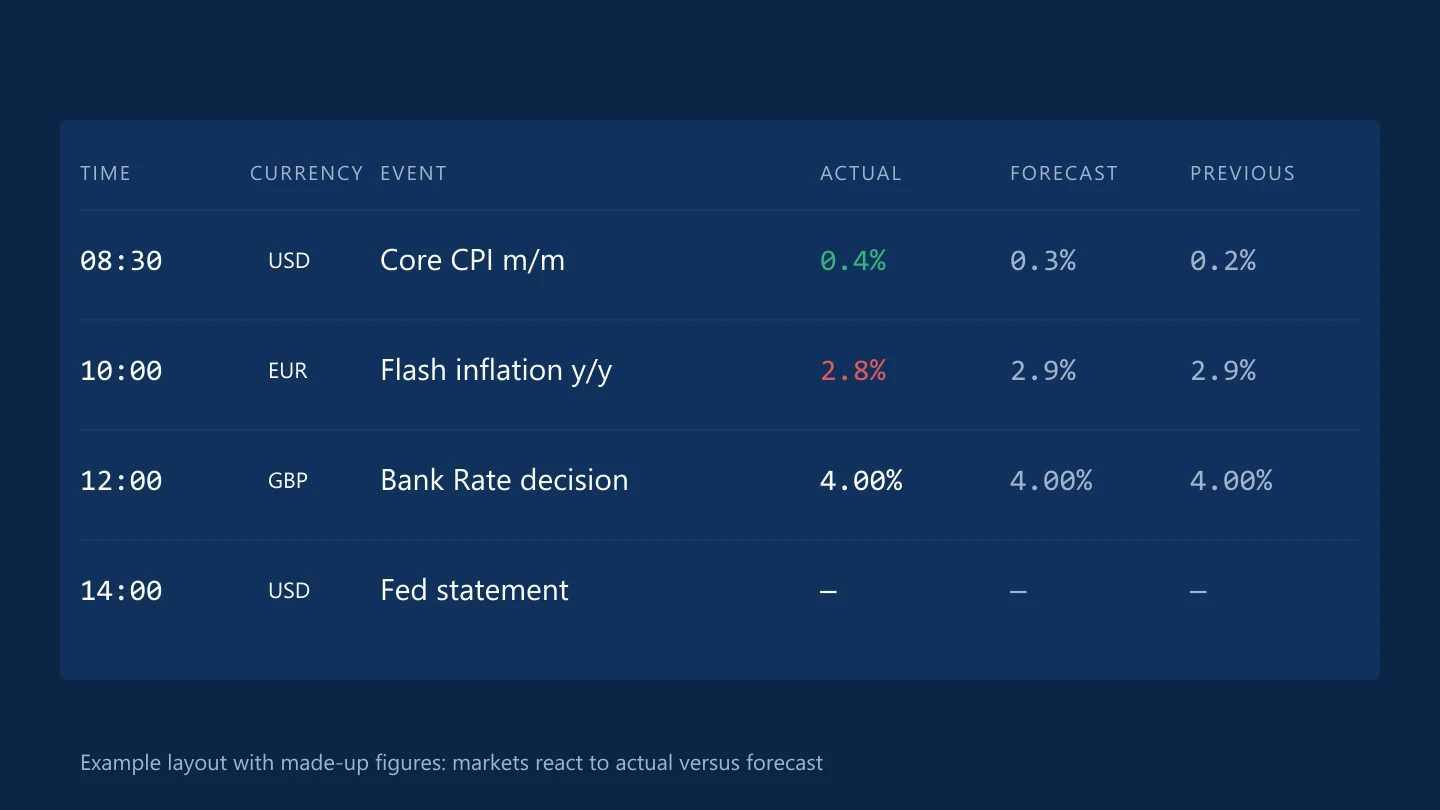
How to read an economic calendar: actual, forecast, previous and impact
The economic calendar tells you when markets are likely to move. Here is what each column means and how traders use it to plan the week.
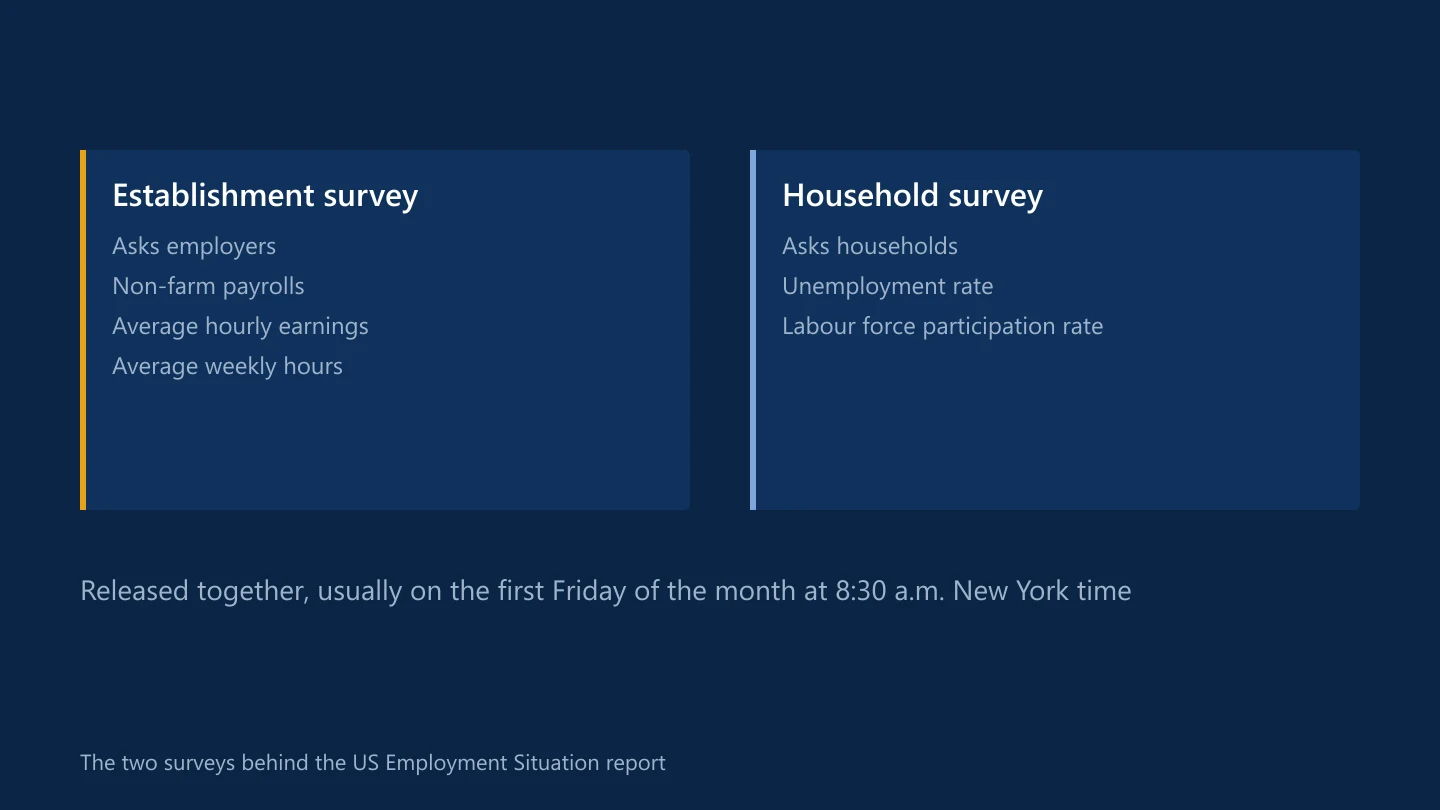
Non-farm payrolls explained: why the US jobs report moves the dollar
The monthly Employment Situation report is one of the most traded events in currency markets. What it measures, when it comes out and why the first move often fades.
CPI explained: headline and core inflation for forex traders
The consumer price index is the inflation figure markets watch most closely. What it measures, why core CPI matters and how it links to interest rates.
How interest rate decisions move currencies
Central bank decisions are the biggest scheduled events in forex. Why rates matter, why a hike can weaken a currency, and what to read beyond the decision.
The Fed's dot plot and economic projections explained
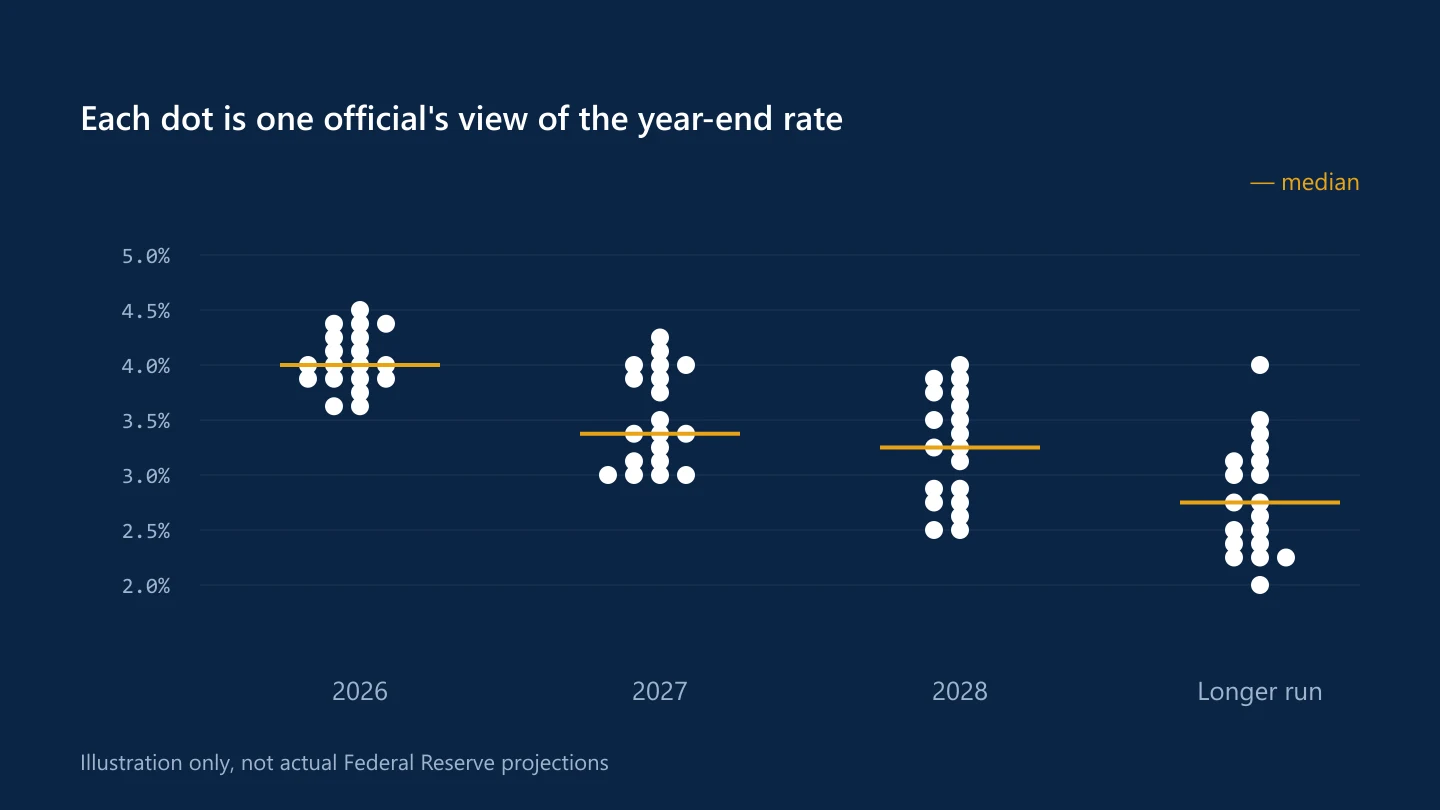
Four times a year Fed officials publish where they think interest rates are heading. How to read the dot plot, and why it can move the dollar more than the decision.
What moves the gold price? Real rates, the dollar and safe-haven demand
Gold pays no interest and has no earnings, so its price responds to a different set of forces than currencies or shares. The main drivers behind XAU/USD.
Oil and currencies: why crude prices move the Canadian dollar
Crude oil links energy markets to currencies through trade, inflation and interest rates. How that works for the Canadian dollar, and why the link isn't fixed.
Safe-haven currencies: why the yen and Swiss franc rise in a crisis
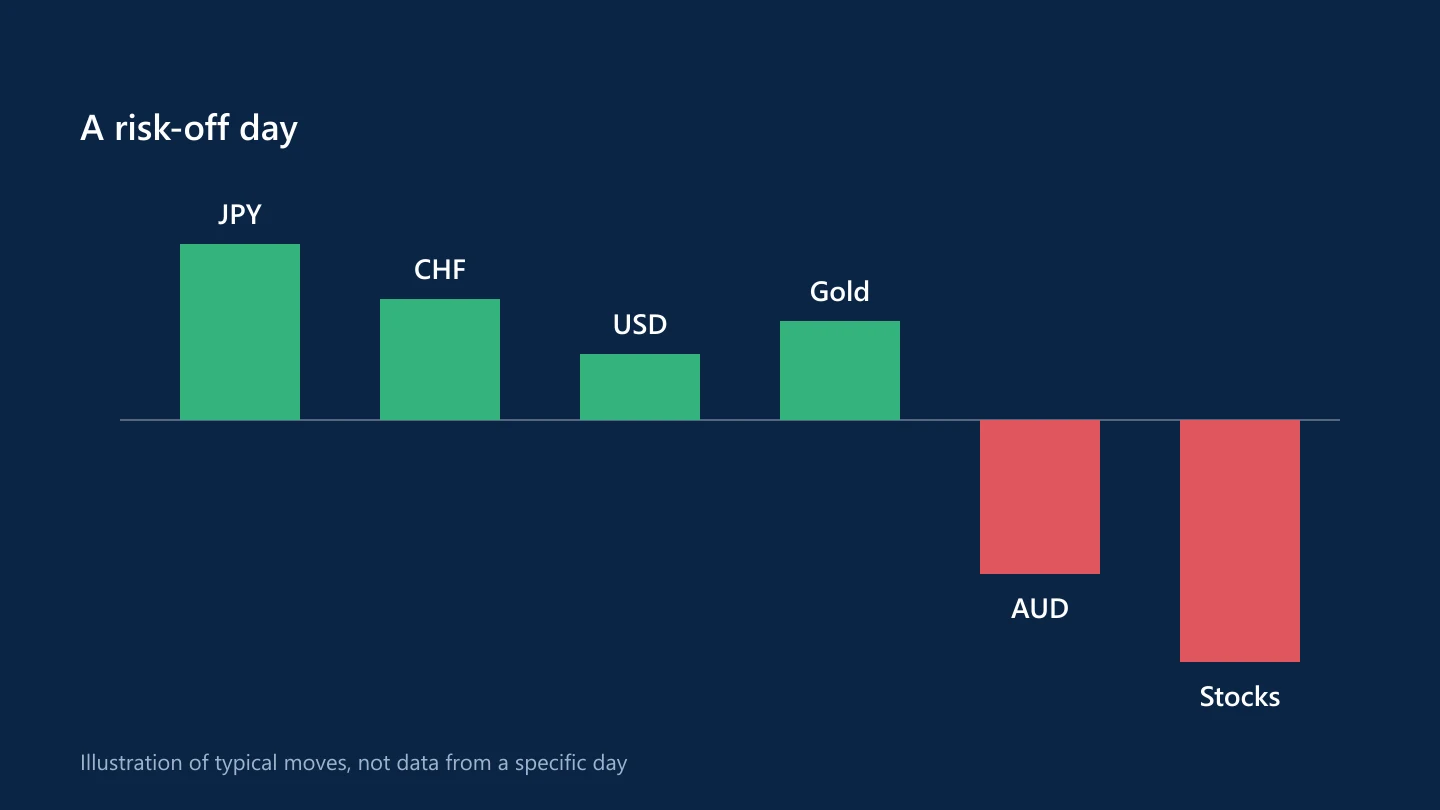
When markets panic, money flows into a few currencies seen as safe. Why the yen, franc and dollar play that role, and when it breaks down.
Position sizing: how to risk a fixed percentage per trade
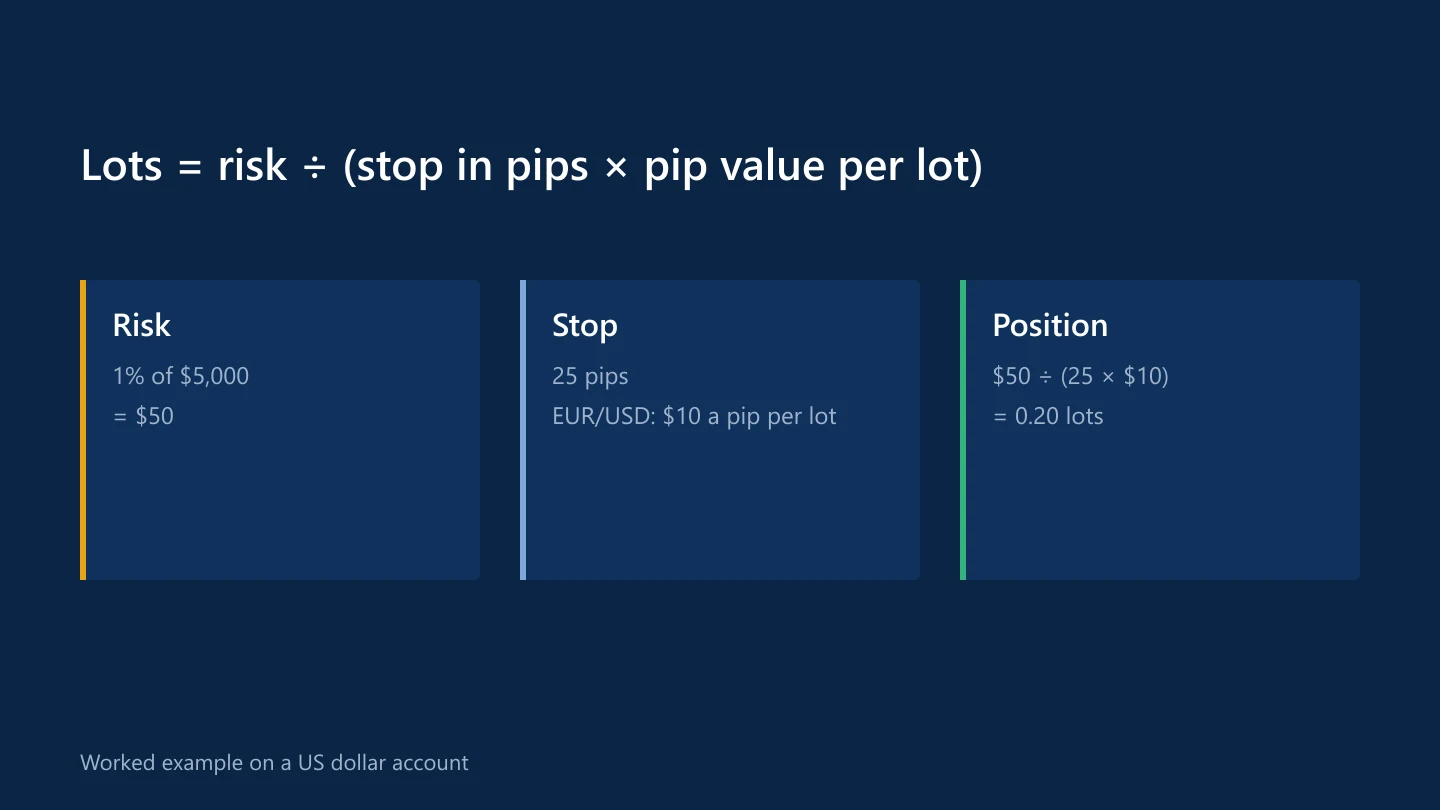
How much you trade matters more than where you enter. A step-by-step method for sizing positions from your stop-loss and the amount you are willing to lose.
Bid, ask and slippage: why your order fills at a different price
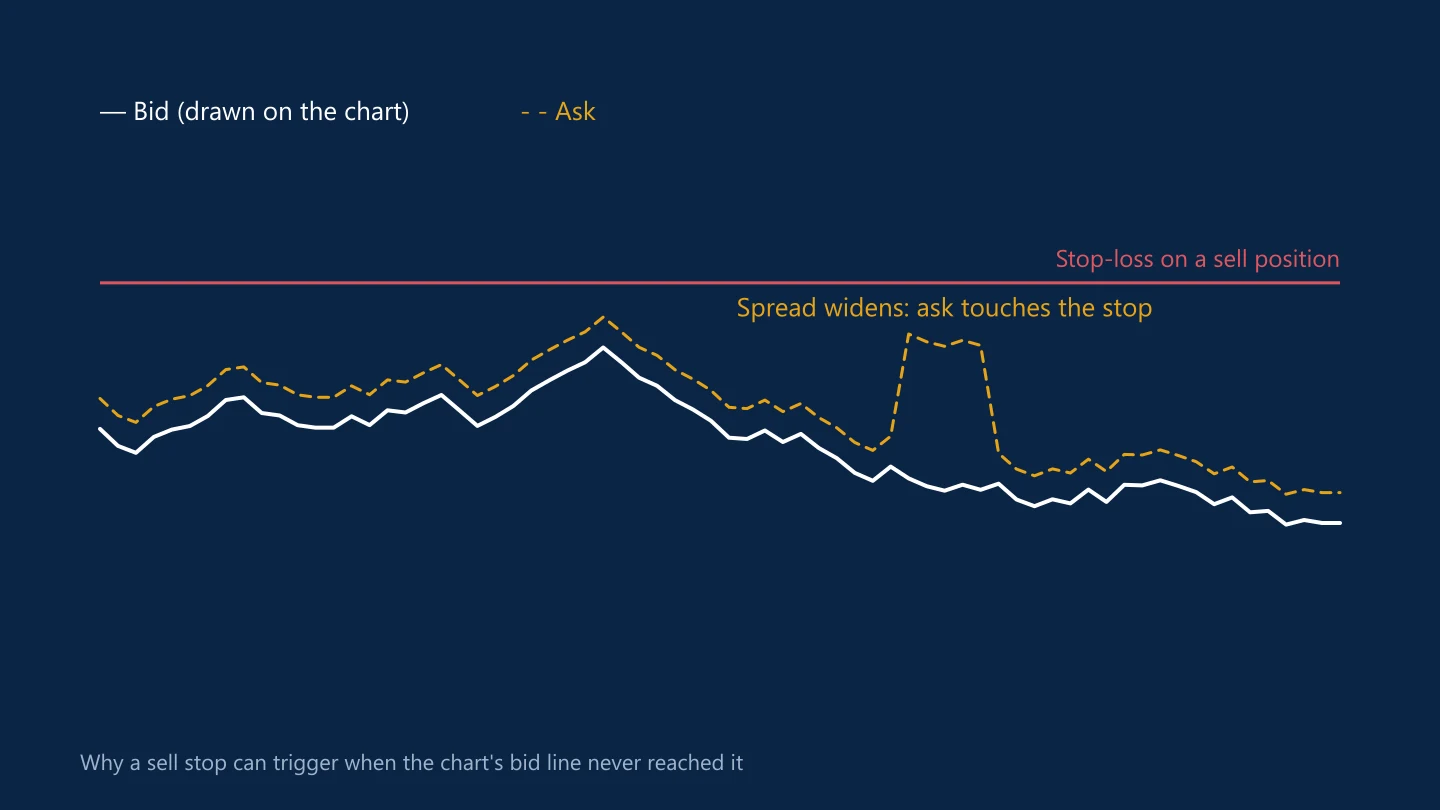
Why buy trades open at one price and close at another, why a stop can trigger when the chart never touched it, and how slippage happens.
Market, limit and stop orders: which order type to use
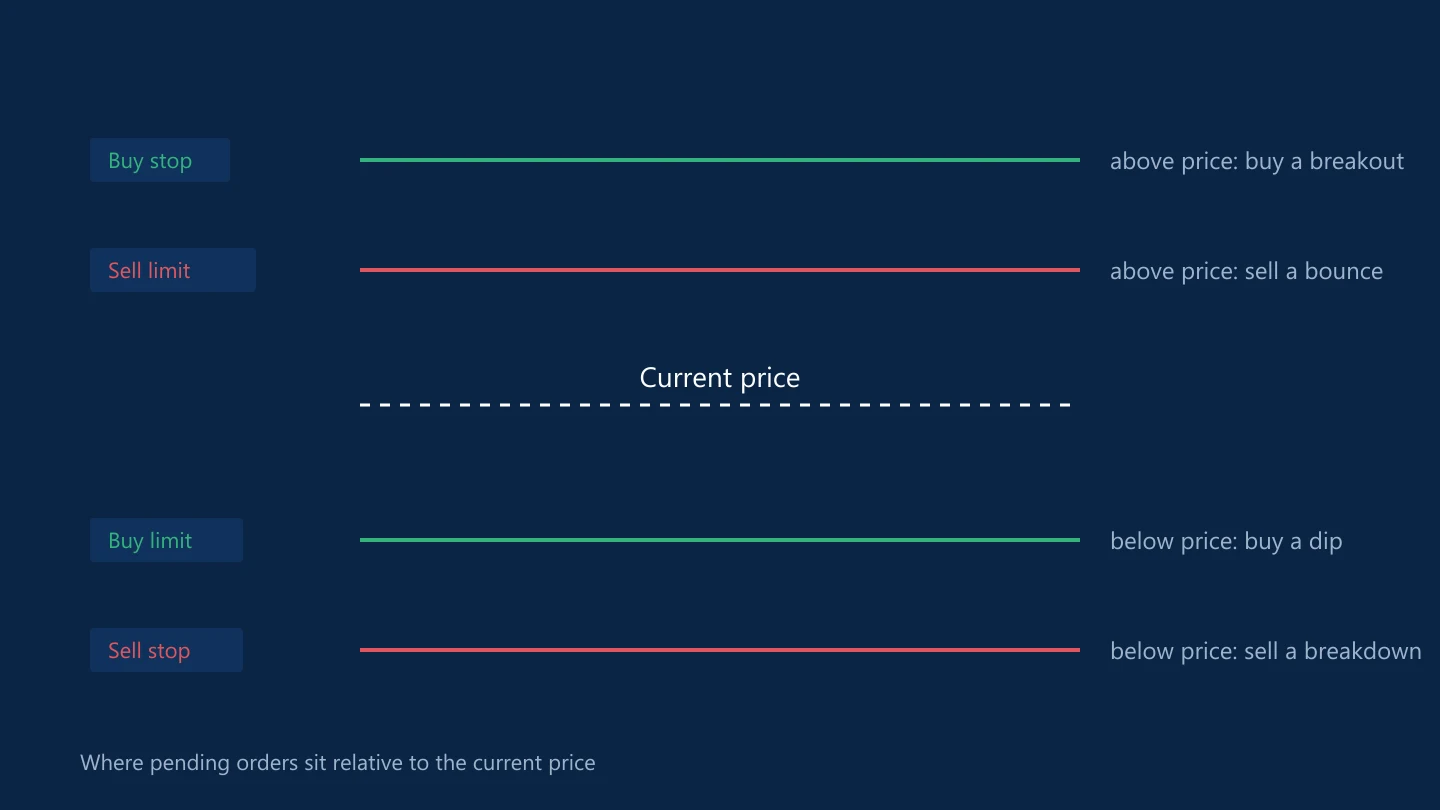
The order types on a trading platform decide when and at what price you enter or exit. What each one does, and the mistakes that cost traders money.
Major, minor and exotic currency pairs explained
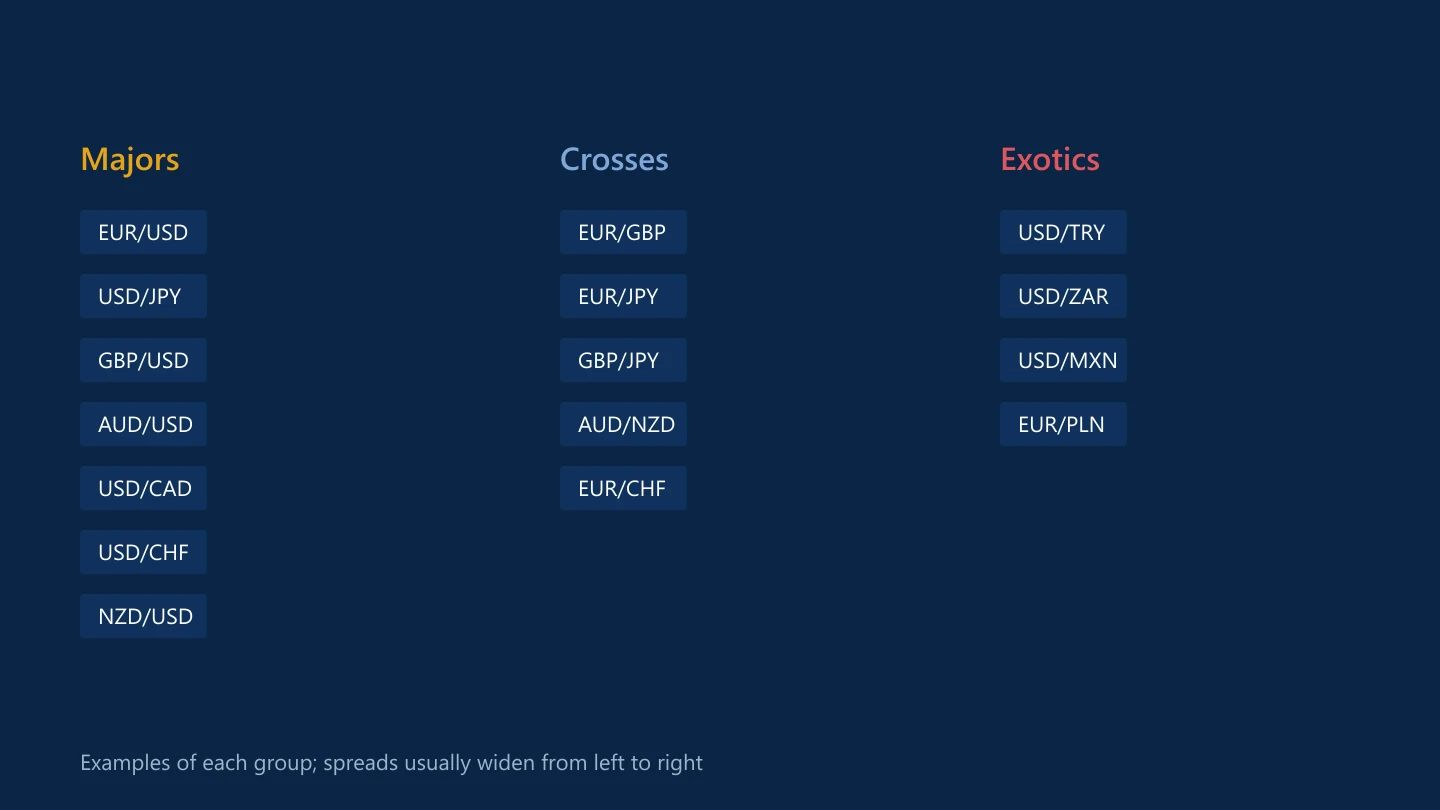
How to read a currency quote, which pairs count as majors, crosses and exotics, and why spreads and risks differ so much between them.
The carry trade explained, and why it can unwind so quickly
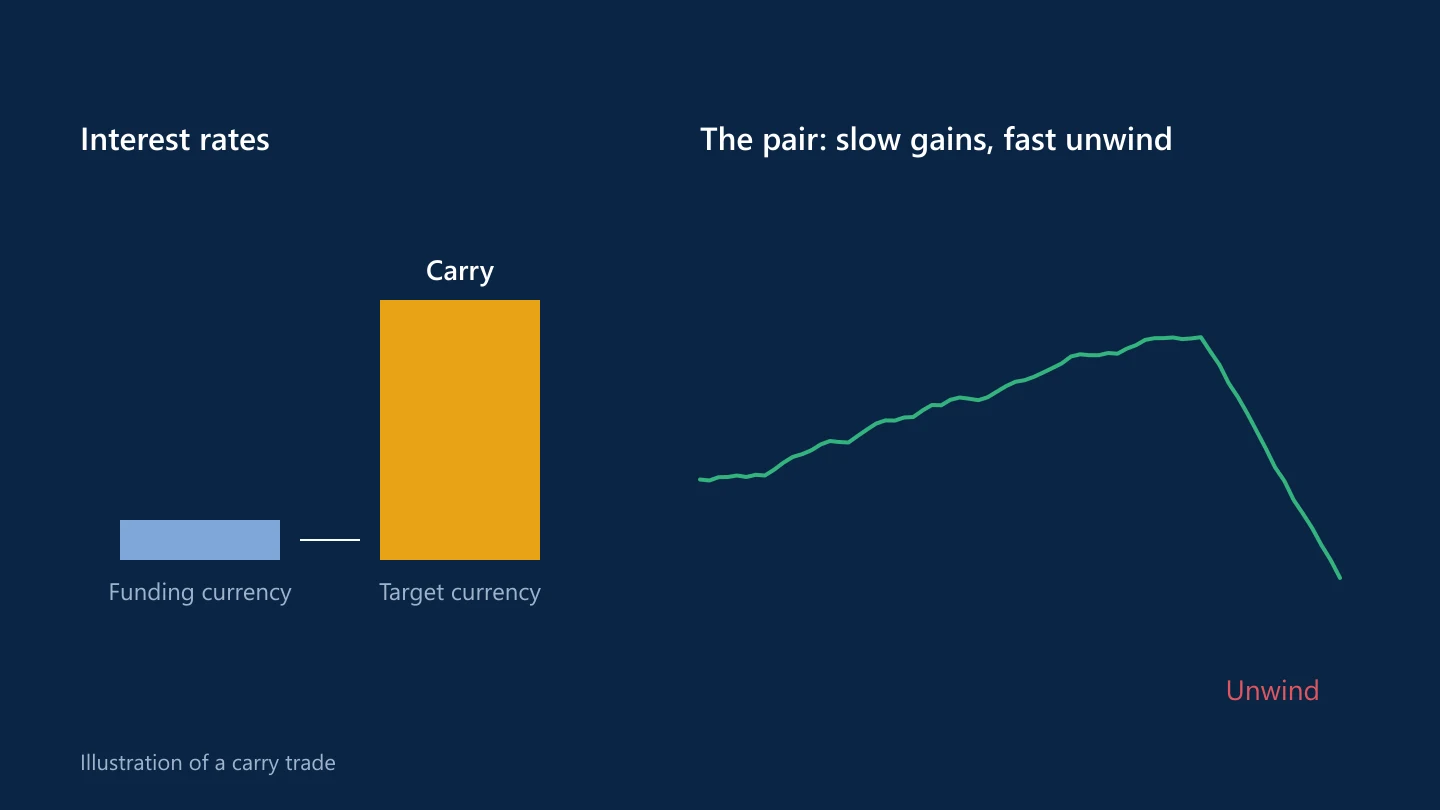
Borrowing in a low-interest currency to hold a high-interest one can earn steady income, until the exchange rate turns. How carry works and where the risk hides.
How to read candlestick charts
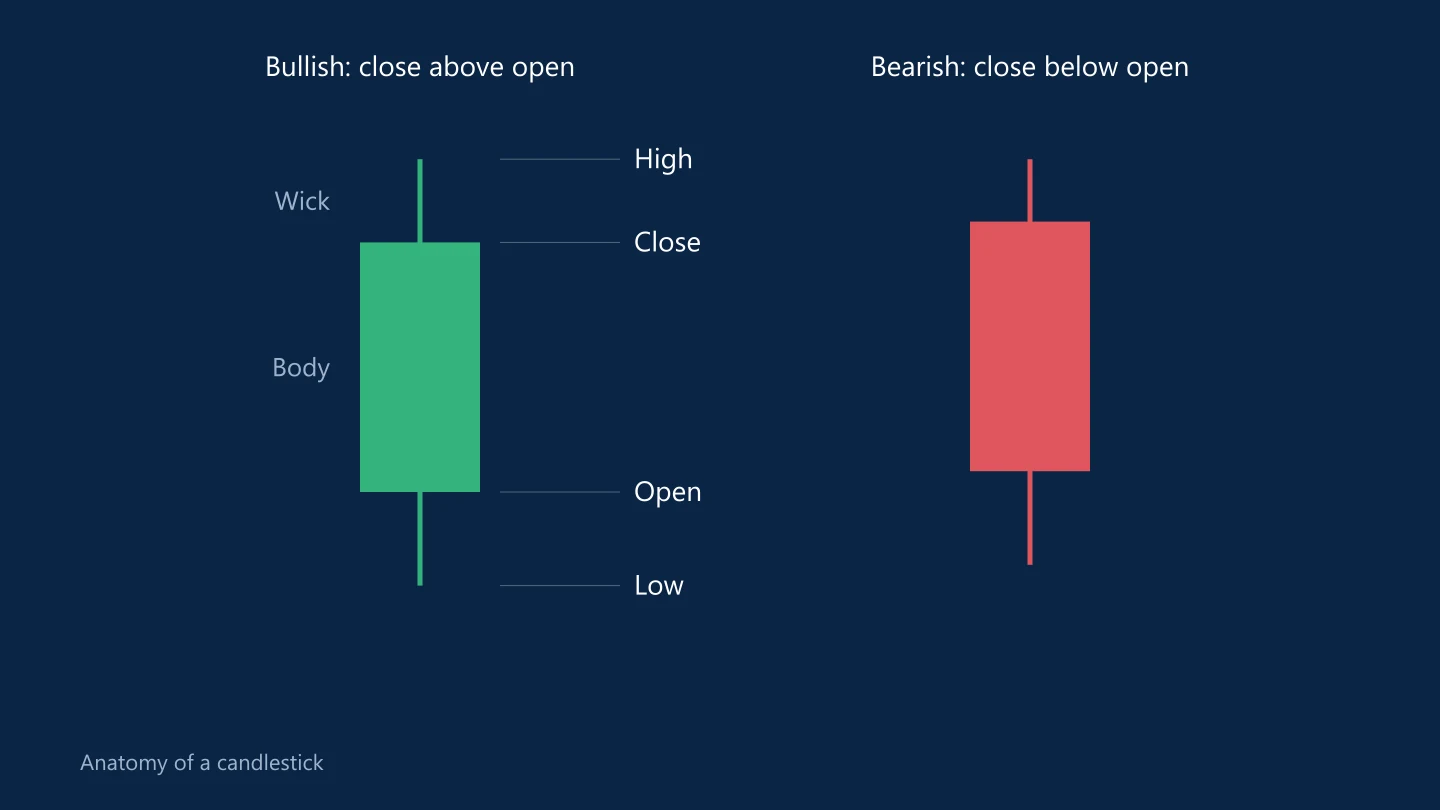
Candlesticks pack four prices into one shape. How to read the body and wicks, what timeframes mean and why single patterns are weaker than they look.
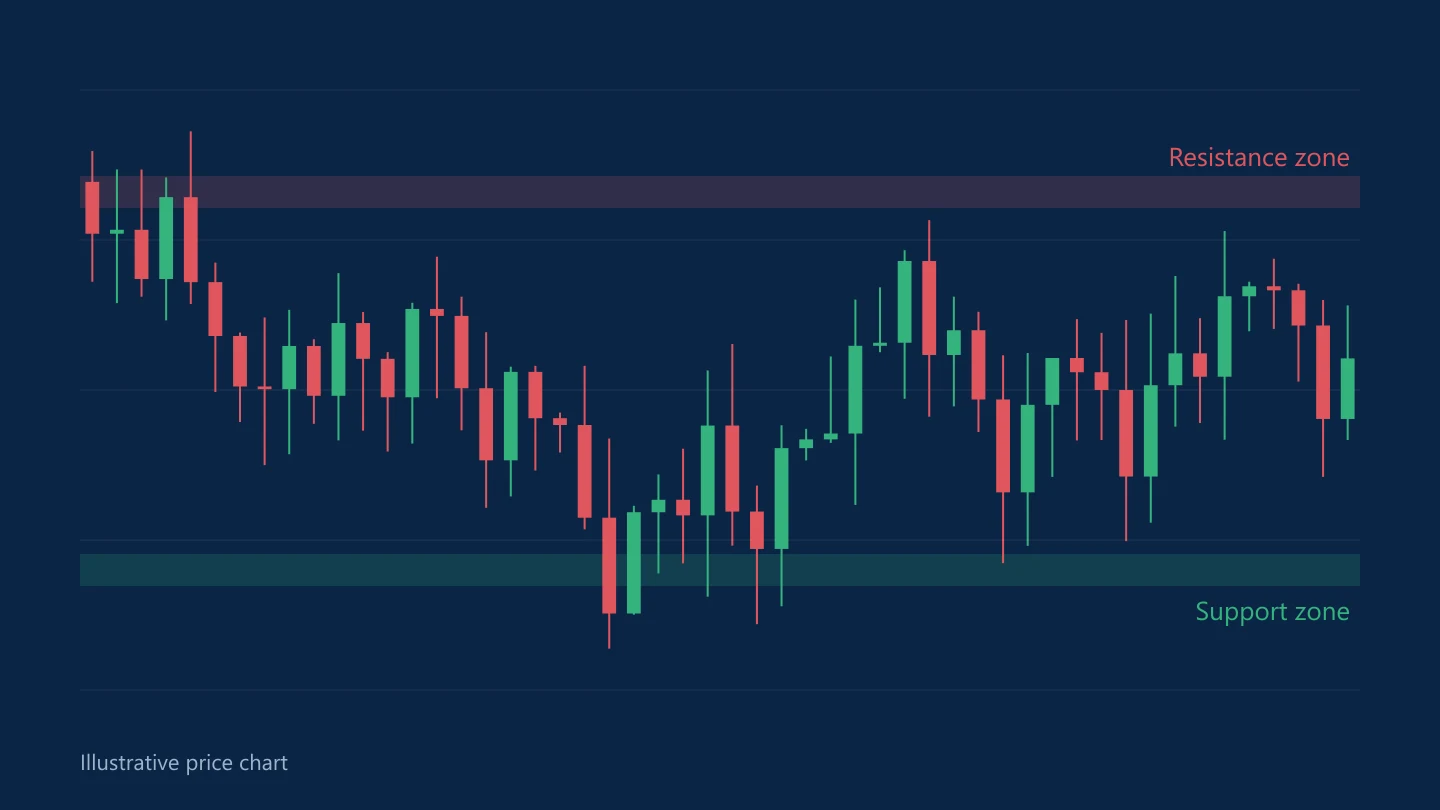
Support and resistance: how traders mark price levels
Support and resistance are the most widely used ideas in chart reading. How to find levels, why they work as zones, and what happens when they break.
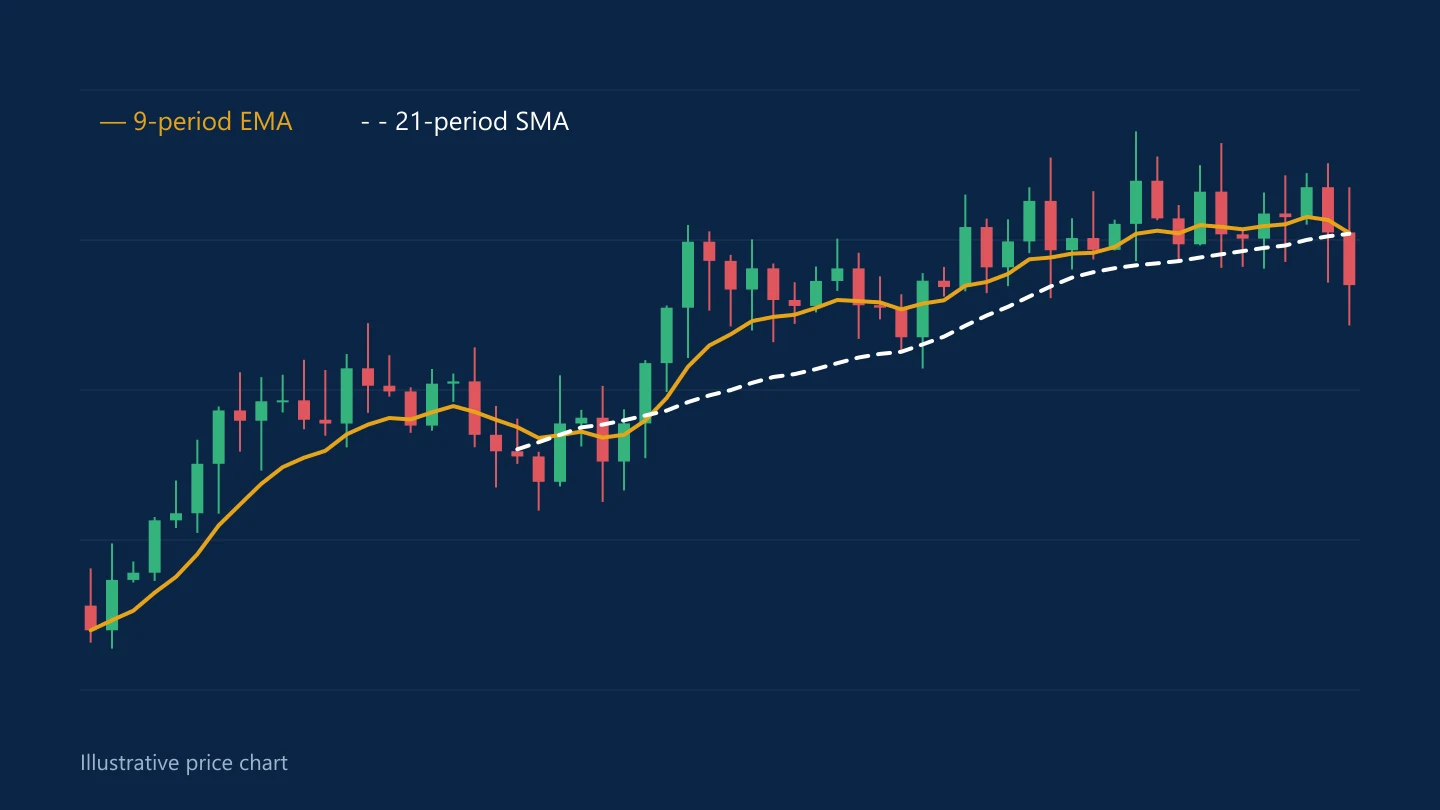
Moving averages explained: SMA and EMA
Moving averages smooth out price noise to show the trend. How simple and exponential averages are calculated, which periods traders use and where they fail.
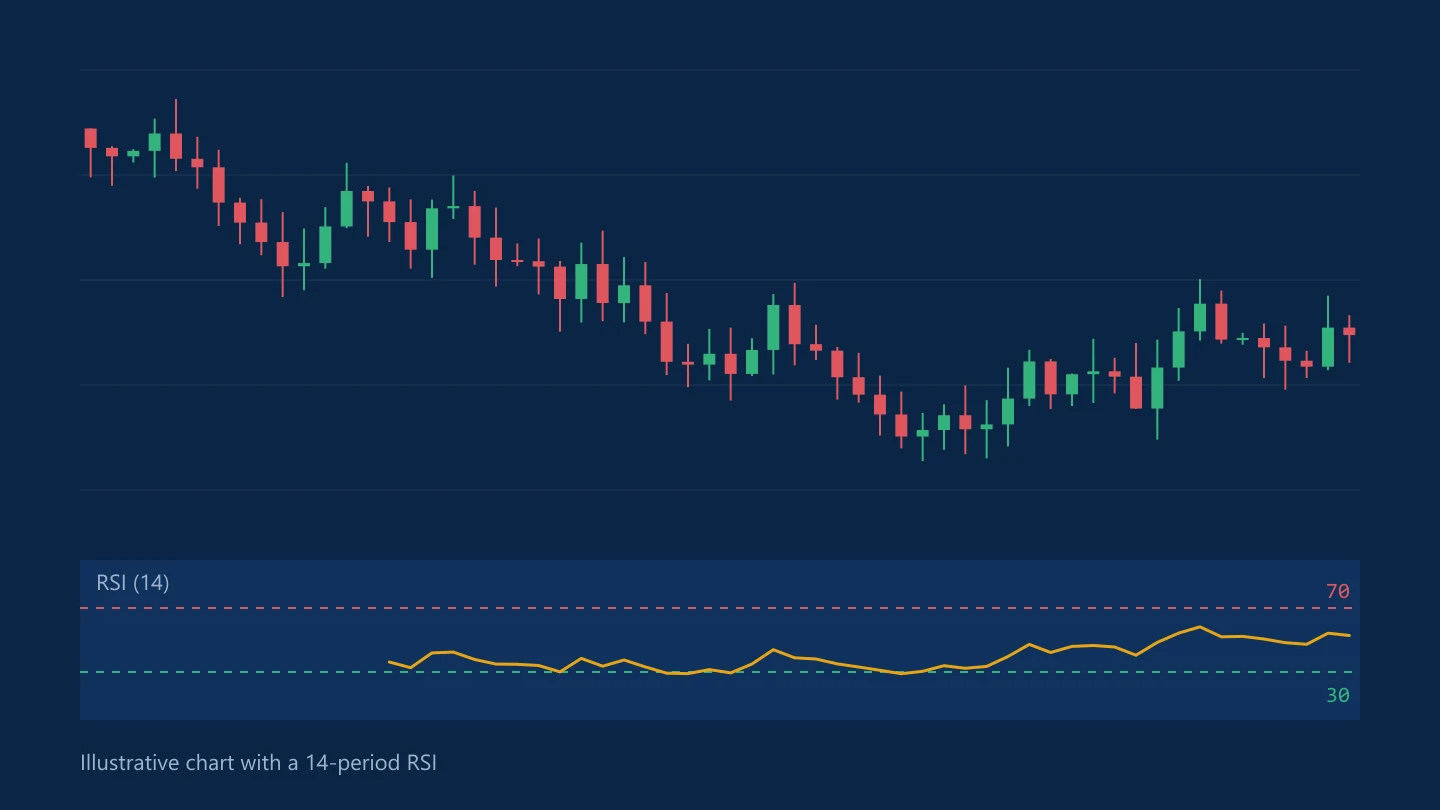
The RSI indicator explained: overbought, oversold and divergence
The Relative Strength Index measures how strong recent moves have been. How it is calculated, what 70 and 30 really mean and why RSI can stay extreme in a trend.
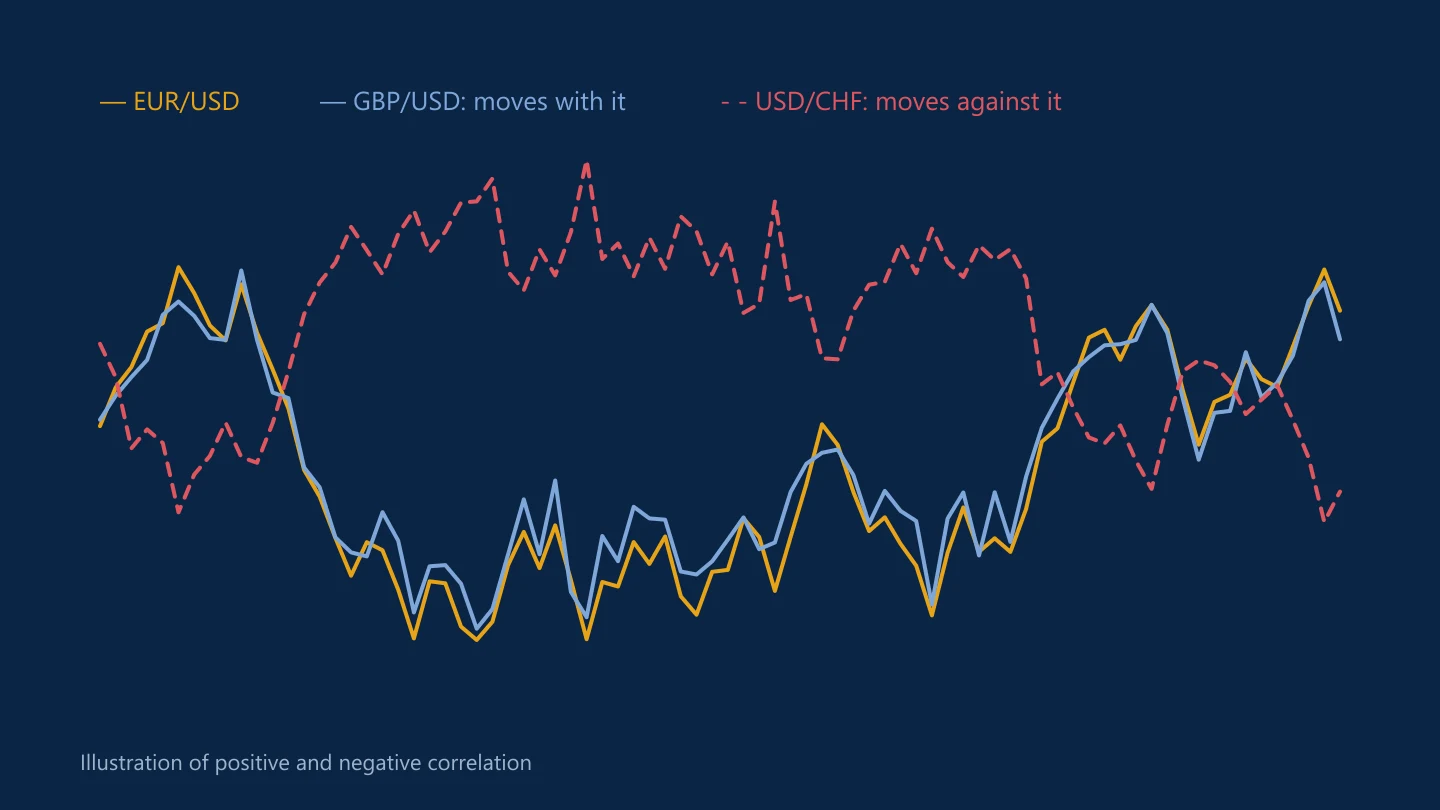
Currency correlation: why EUR/USD and GBP/USD often move together
Pairs that share a currency or an economic driver tend to move in step. How correlation works, why it changes and how it can quietly double your risk.
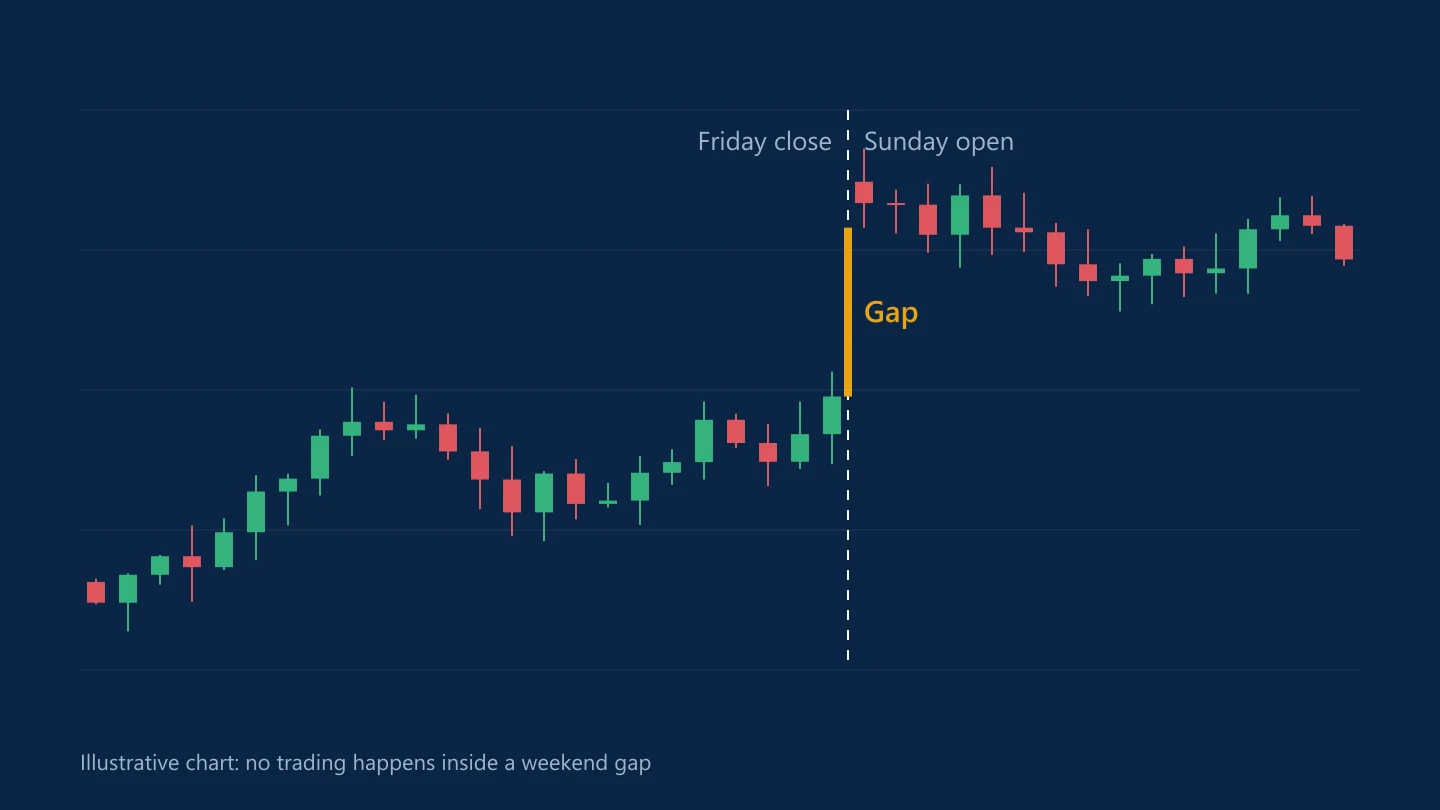
Weekend gaps: why prices jump when the forex market reopens
Currencies stop trading on Friday evening, but the news doesn't. What happens to your positions and stops when the market reopens at a different price.
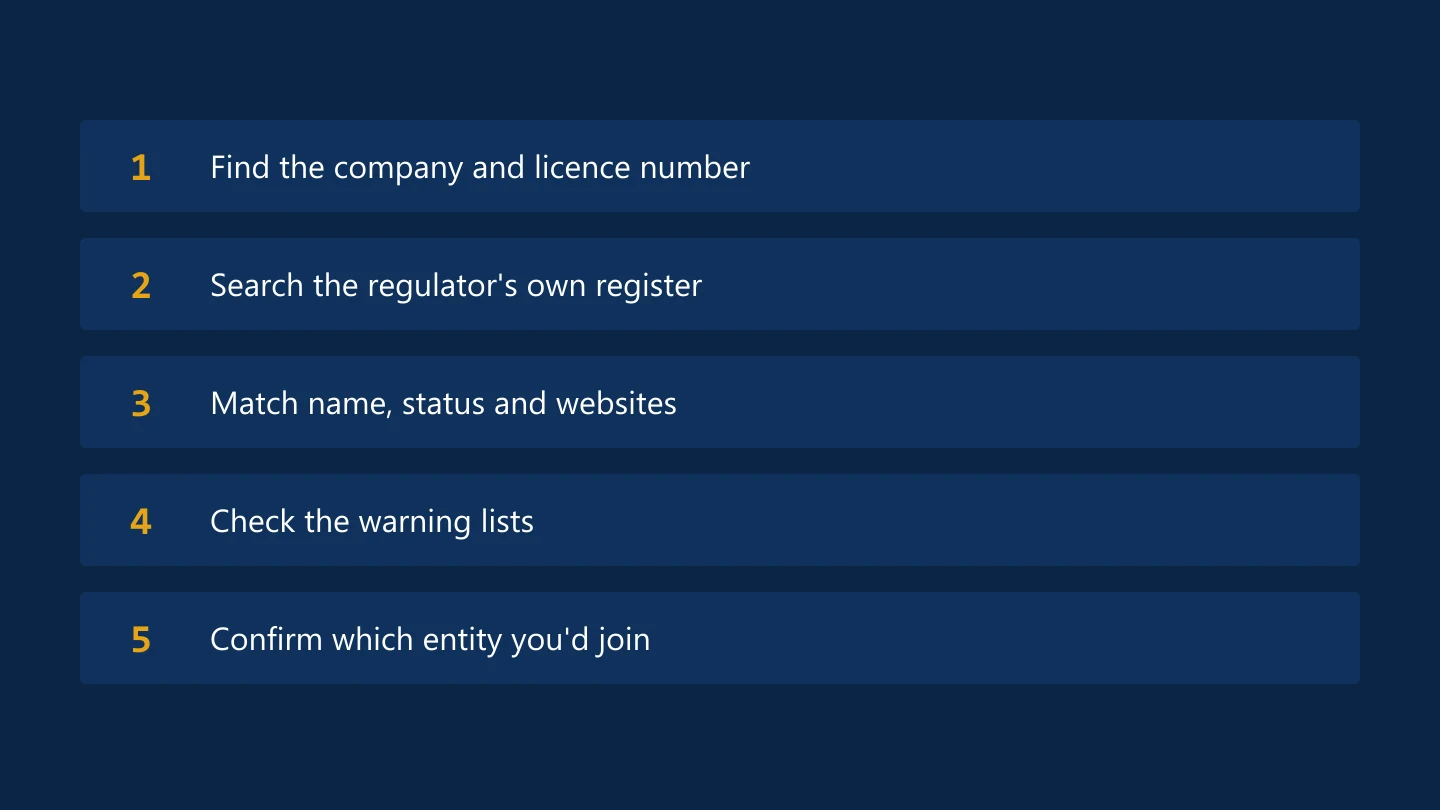
How to check whether a forex broker is regulated
A licence number on a website proves nothing until you have checked it yourself. A step-by-step check using regulators' own registers, and the tricks clone firms use.
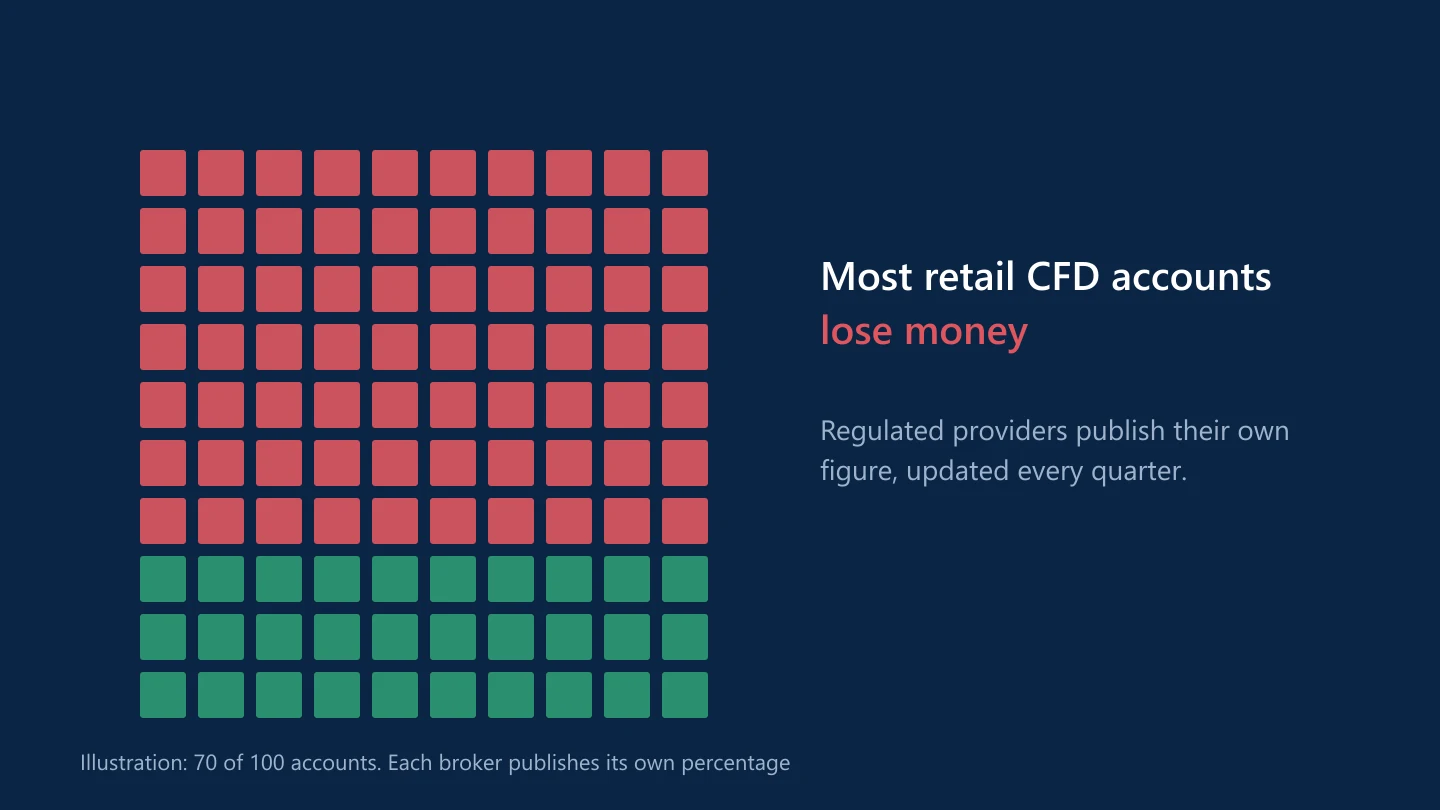
What the “% of retail accounts lose money” warning actually means
Regulated CFD brokers must publish the share of their retail clients who lose money. How the figure is calculated, what it tells you and what it doesn't.
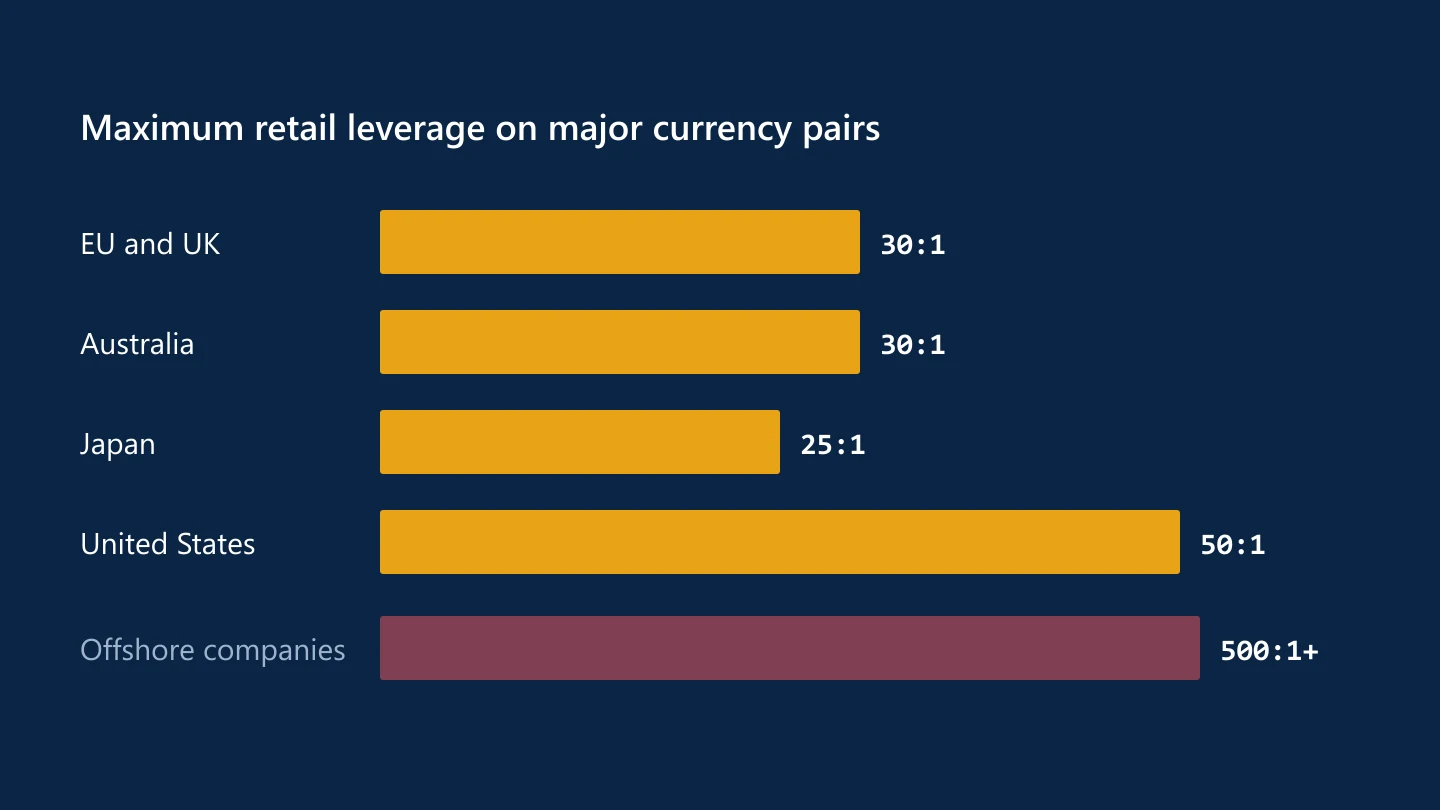
Leverage limits for retail traders in the EU, UK, Australia, Japan and the US
Regulators cap how much leverage brokers can give retail clients. The limits by market and region, and what professional status changes.
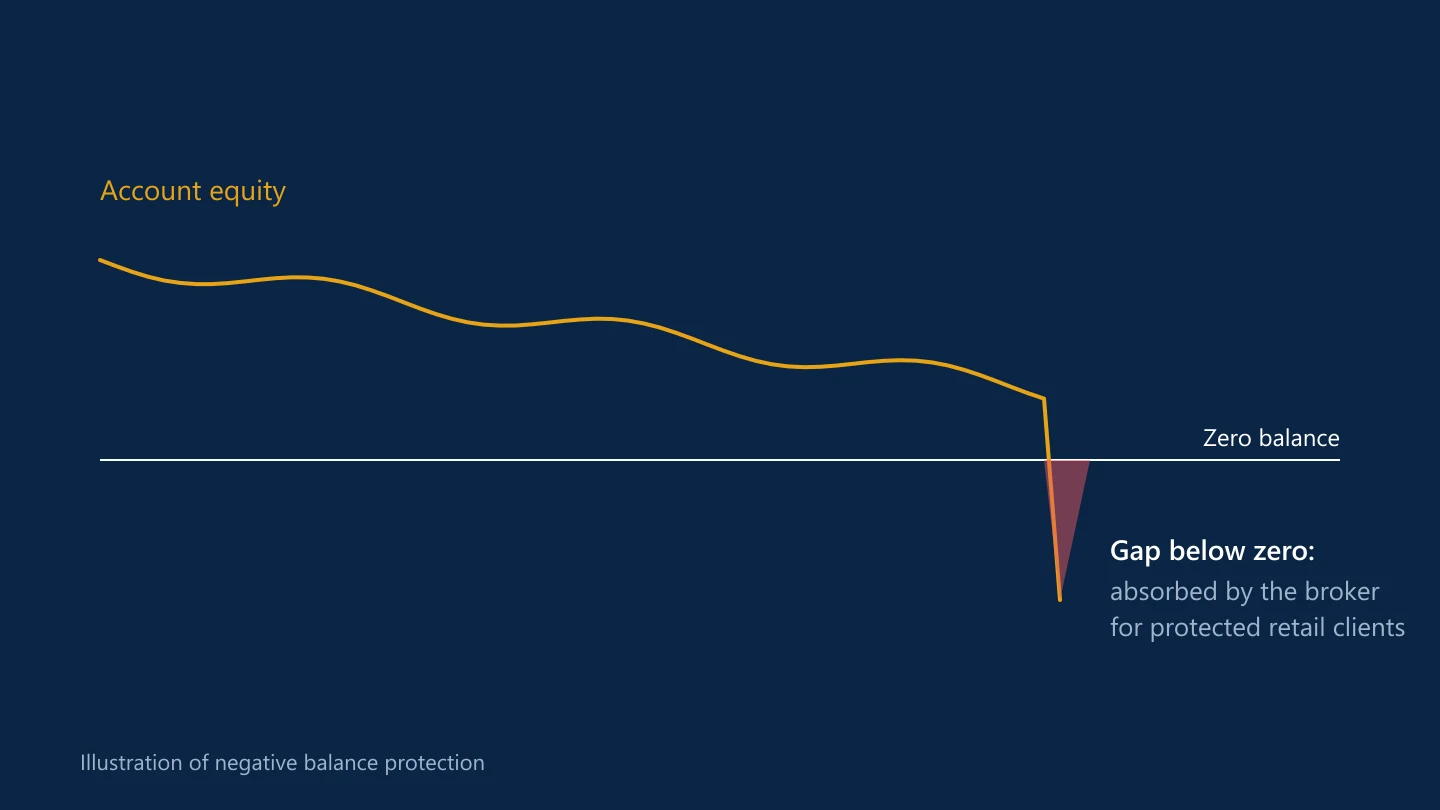
Negative balance protection, client money and compensation schemes
What happens to your money if a trade goes badly wrong, or if your broker goes bust? The protections that apply in the UK, EU, Australia and the US, and their limits.
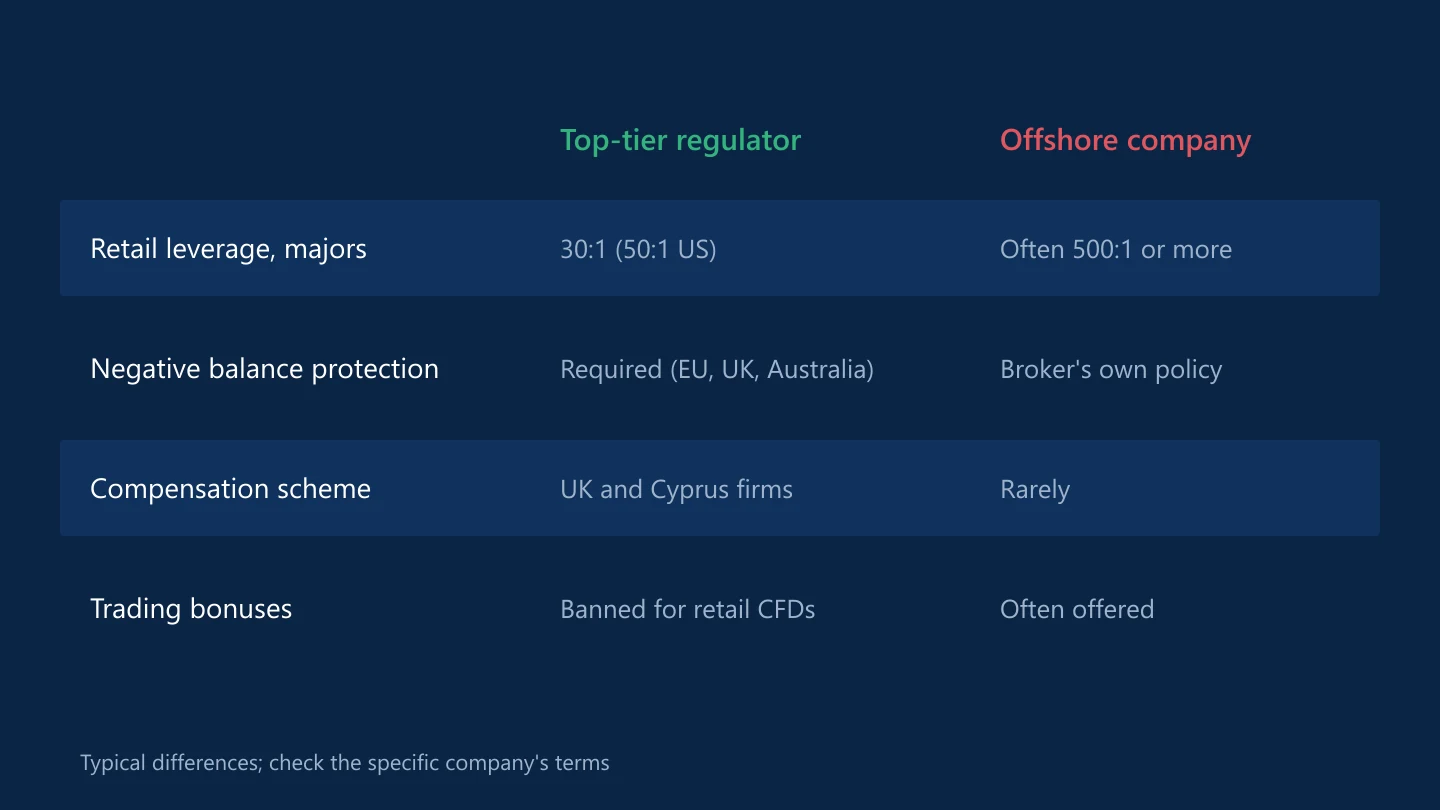
Offshore brokers vs top-tier regulation: what changes for you
Many well-known brands open accounts for clients in some countries through offshore companies. What you gain in leverage and what you give up in protection.
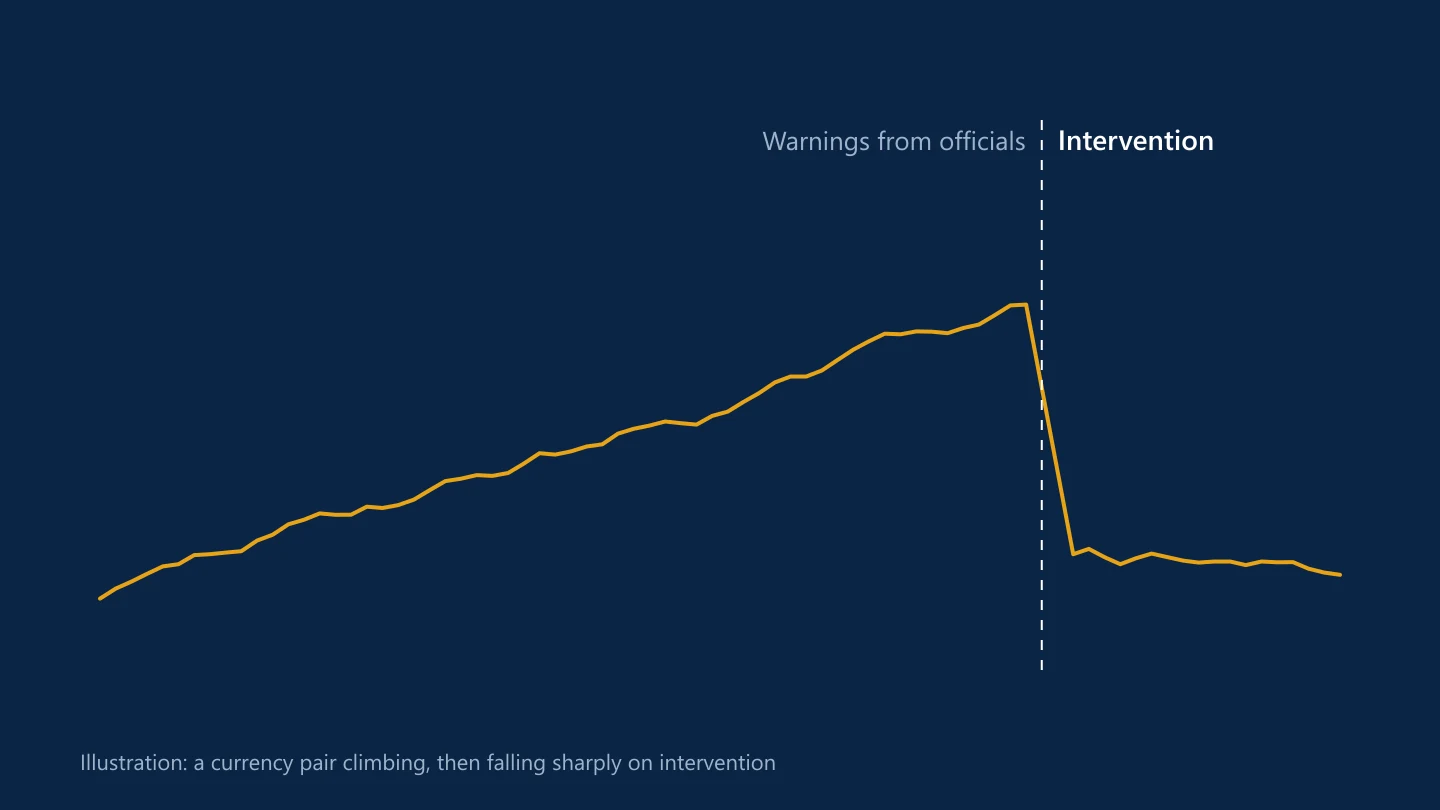
Currency intervention explained: how and why governments step in
When a currency moves too far, too fast, authorities can buy or sell it directly. How intervention works, Japan's record operations and what it means for traders.
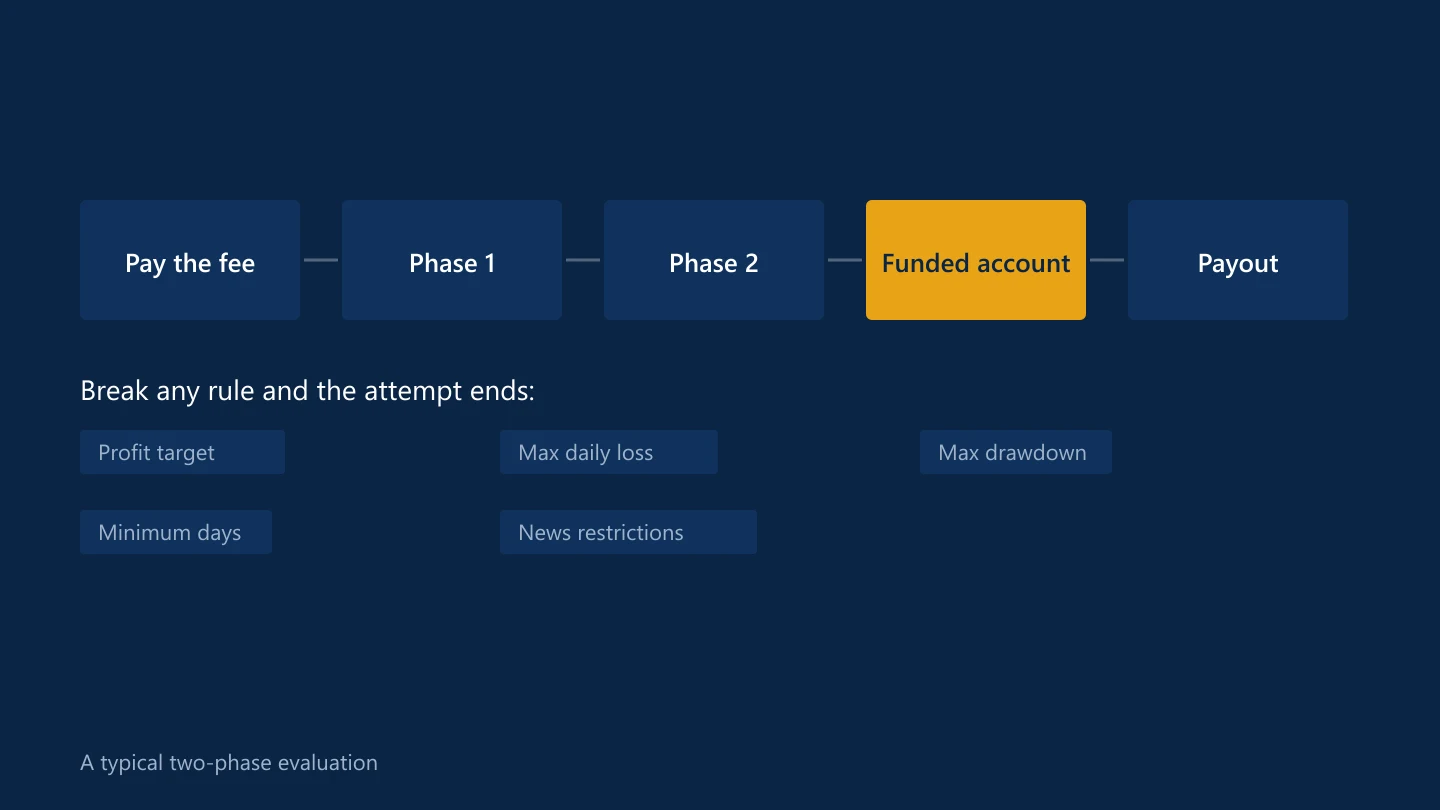
How prop firm evaluations work, and the risks to know first
Proprietary trading firms sell challenges that promise a funded account. What you are actually paying for, the rules that end most attempts, and what to check before buying one.
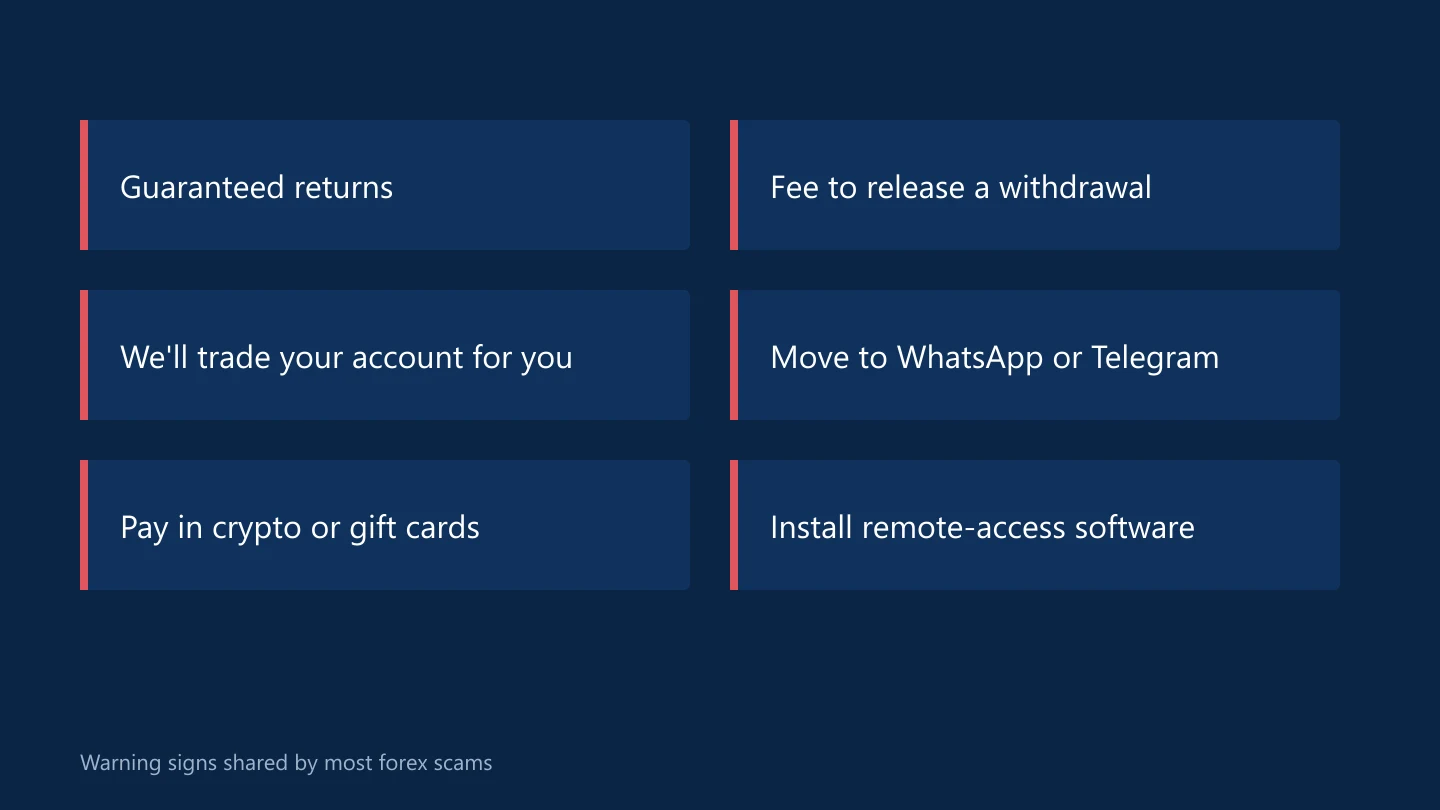
Forex scams: the warning signs, and how recovery scams work
Fake brokers, signal sellers, account managers and romance-investment schemes all target forex traders. The patterns they share and what to do if you have been caught.
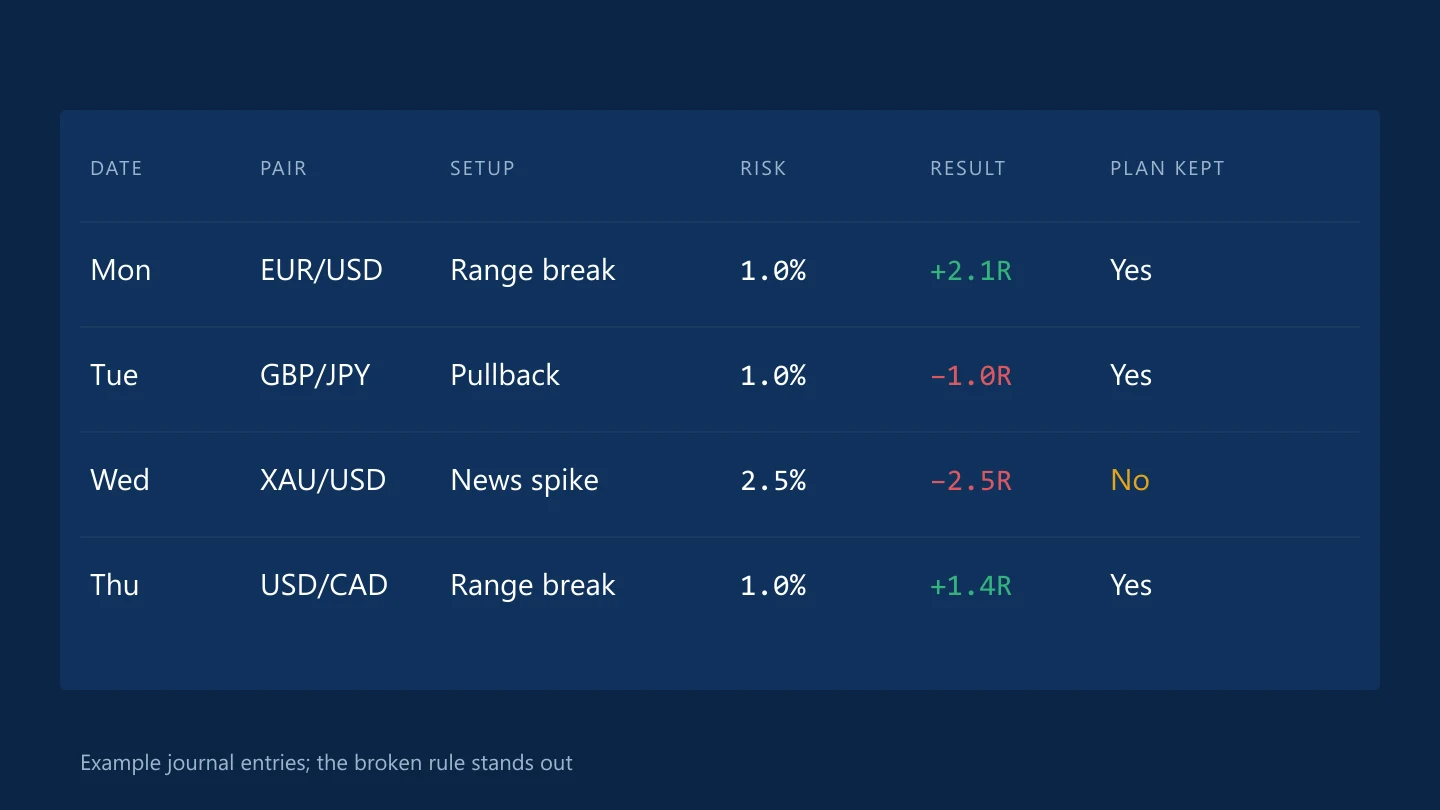
How to keep a trading journal that actually improves your trading
A journal turns a pile of trades into evidence. What to record, the numbers worth calculating and a weekly review routine that takes less than an hour.
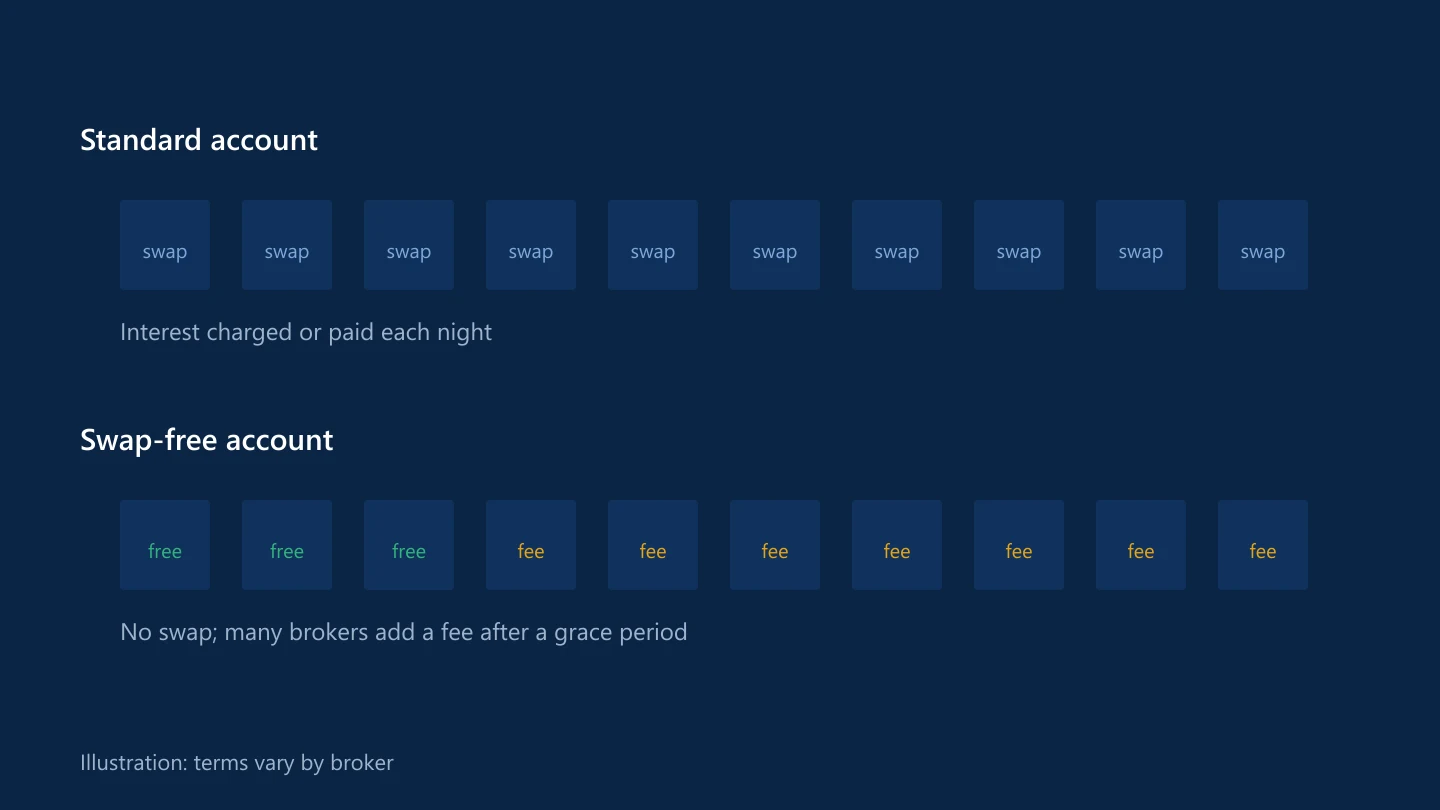
Swap-free (Islamic) accounts explained
Swap-free accounts remove overnight interest charges and credits. Who they are for, how brokers replace the income, and the conditions to read before switching.
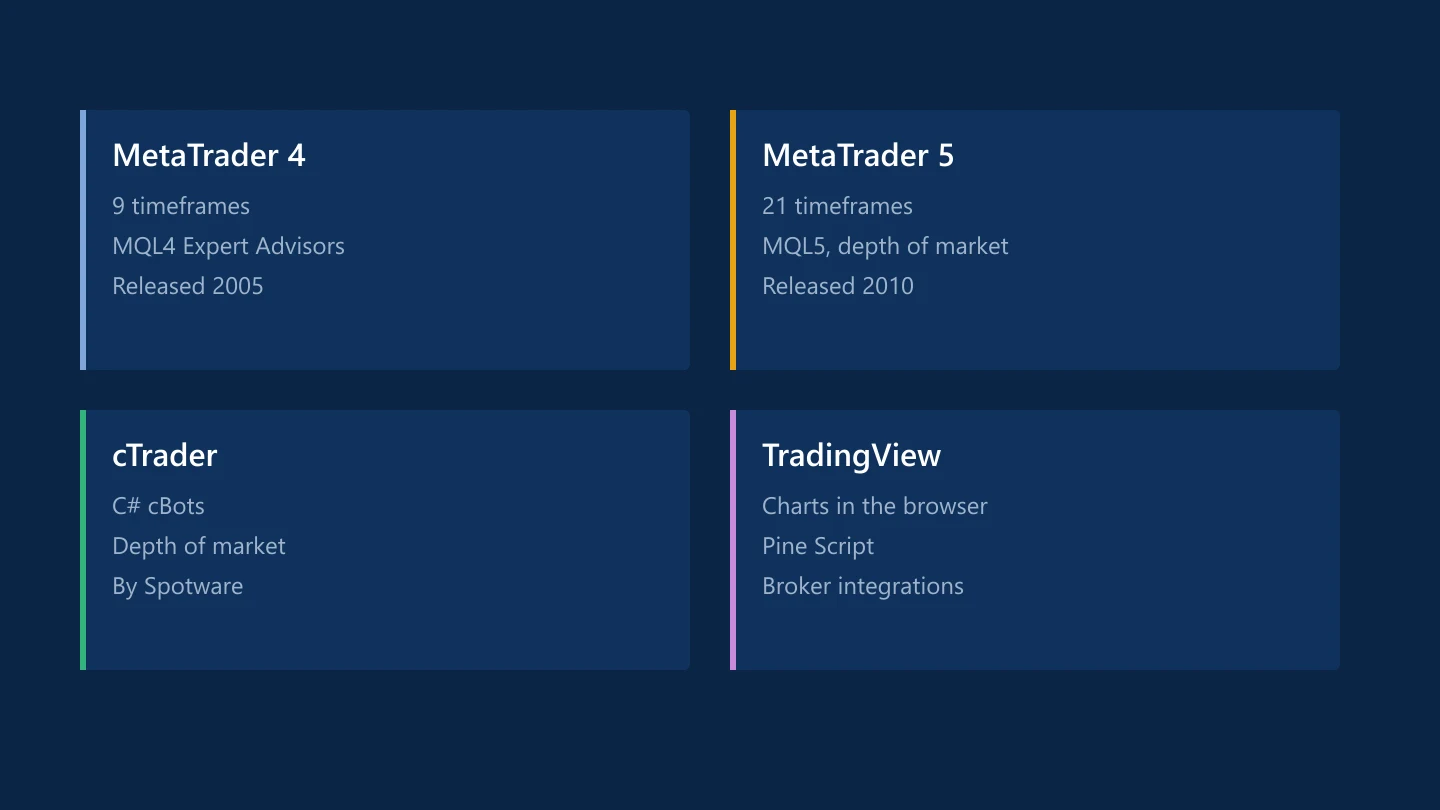
MetaTrader 4 vs MetaTrader 5 vs cTrader vs TradingView
The four platforms most forex traders choose between, compared on charting, order types, automation and broker availability.
PMIs explained: the survey data that moves currencies early
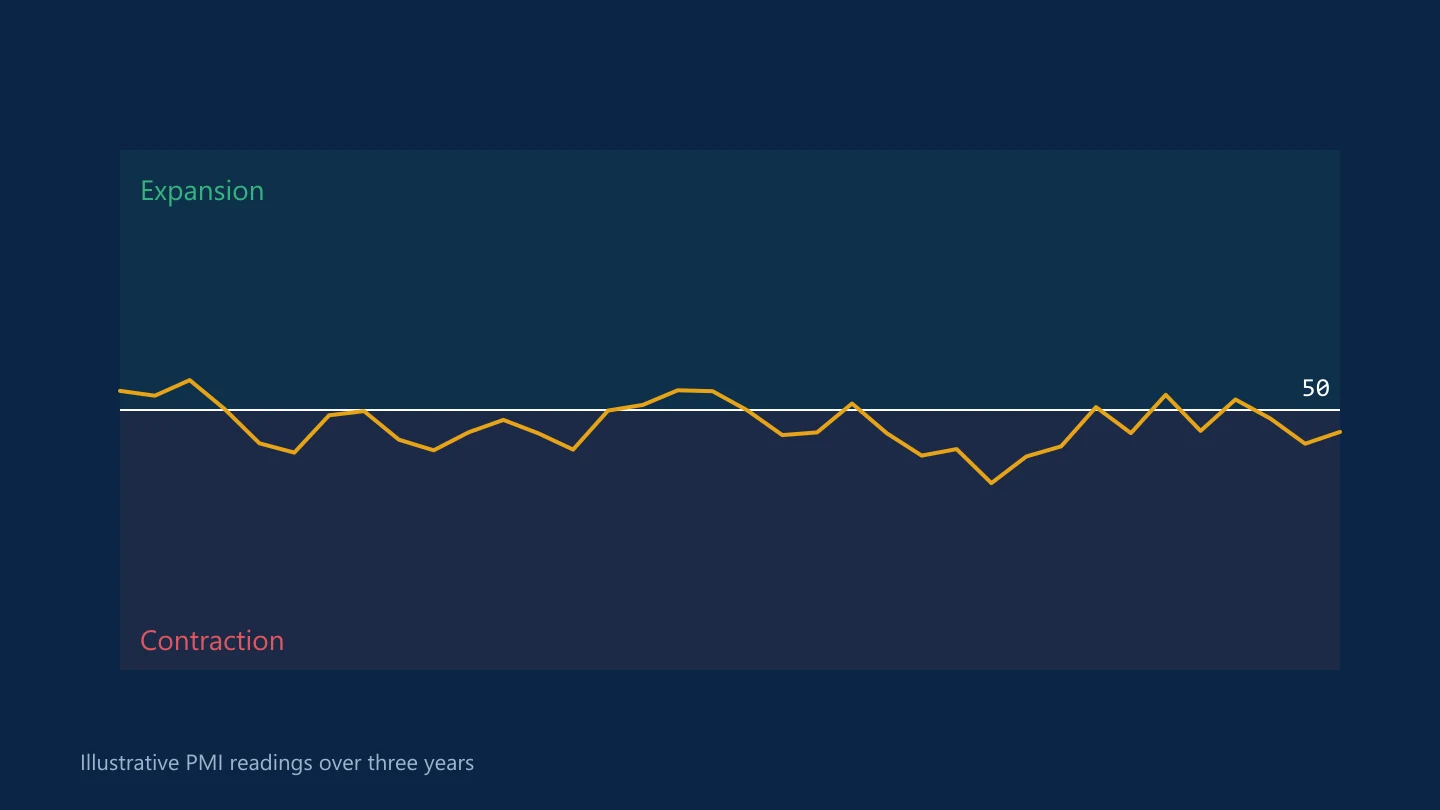
Purchasing managers' indexes are among the first economic numbers published each month. What the 50 line means, which PMIs matter and how traders use them.
Demo vs live trading: what changes when real money is on the line
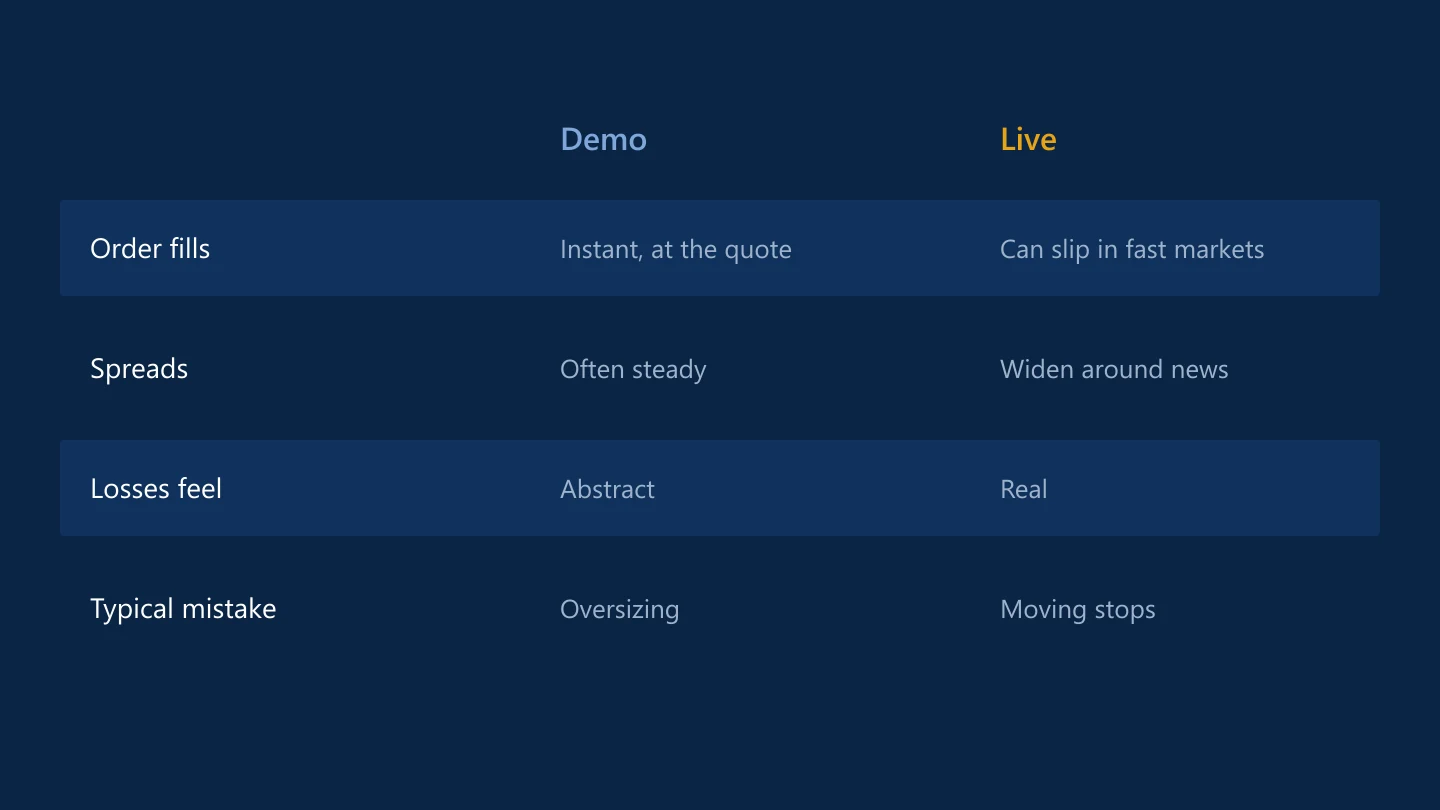
A strategy that works on a demo account can fall apart in a live one. The differences in execution and psychology, and a sensible way to make the switch.
Trading forex from the United States: leverage limits, FIFO and no CFDs
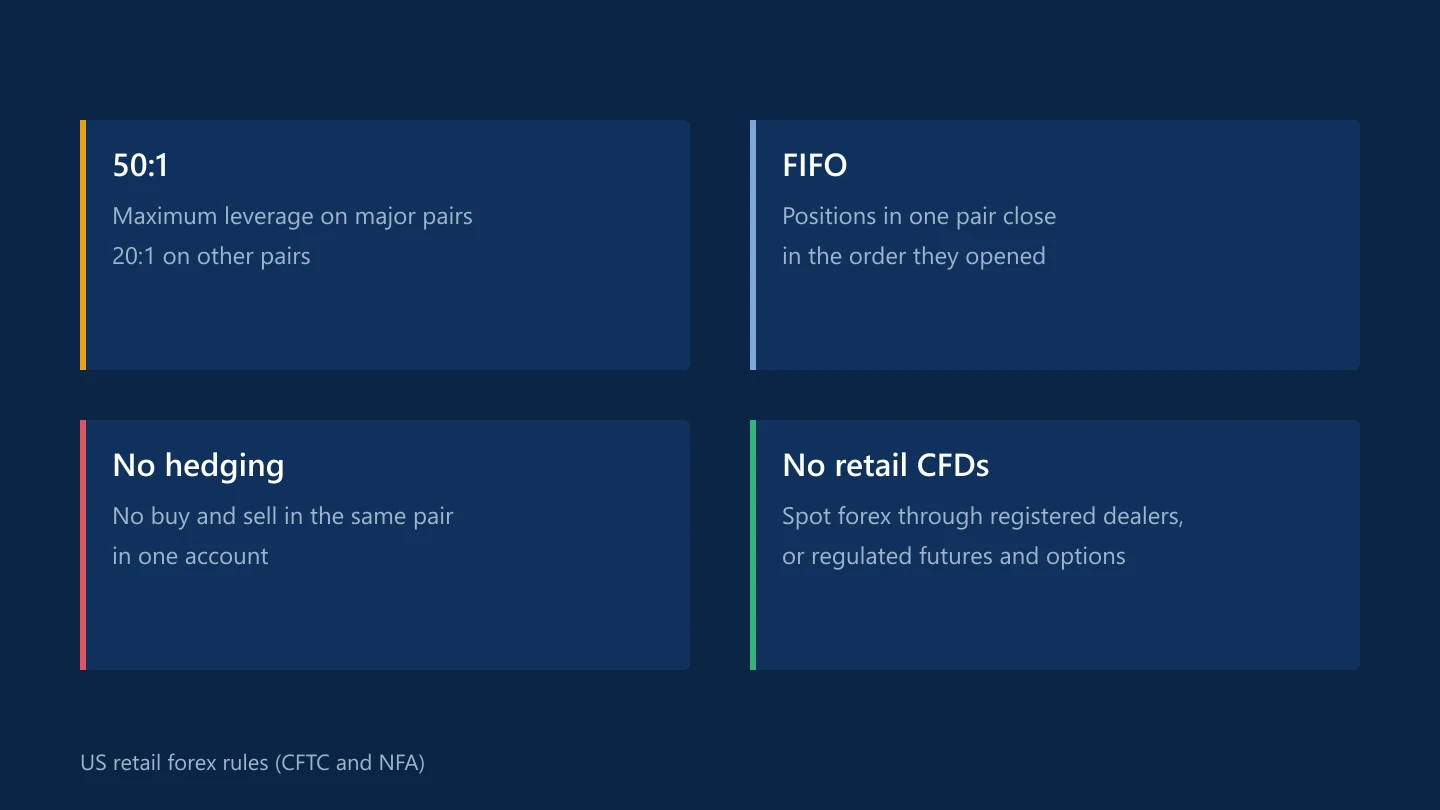
US retail forex traders work under different rules from almost everyone else. Who can offer accounts, what the NFA's rules mean in practice and why offshore offers are risky.
Fibonacci retracements explained: the 38.2%, 50% and 61.8% levels
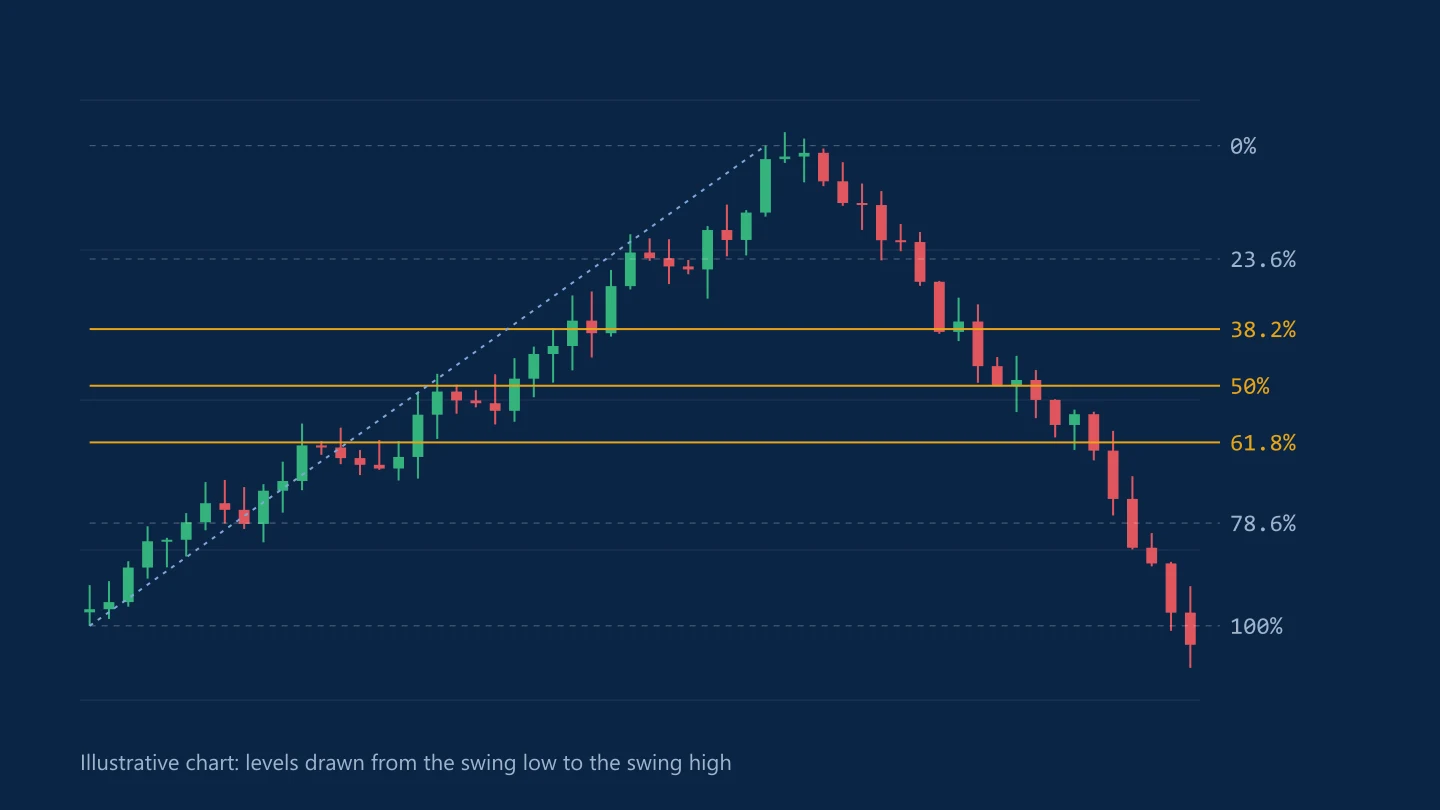
How traders draw Fibonacci retracement levels across a price swing, where the ratios come from, and why the levels work best as zones alongside other evidence.
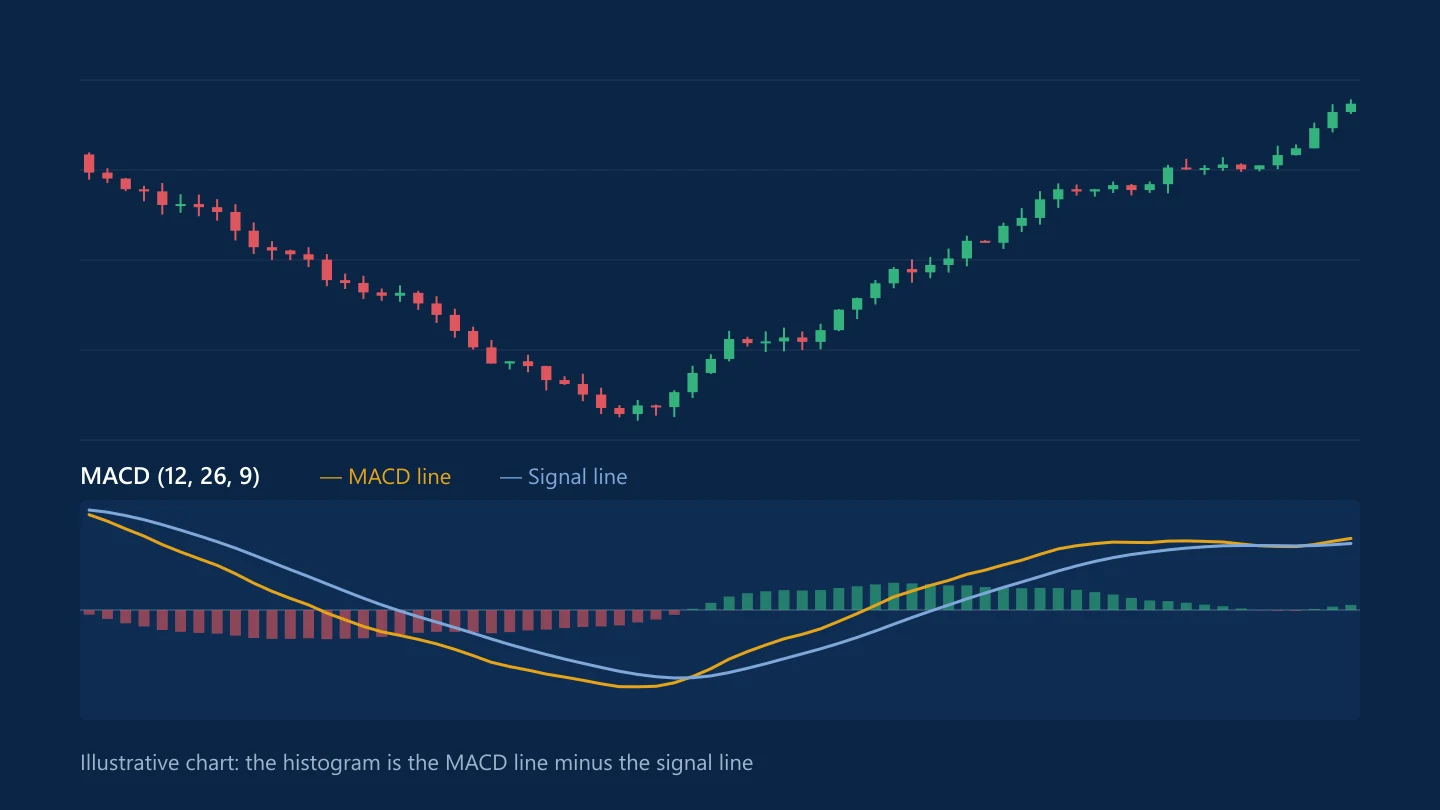
The MACD indicator explained: signal line, histogram and divergence
MACD measures the gap between two exponential moving averages. Here is how the line, signal line and histogram are calculated, and the ways traders read them.
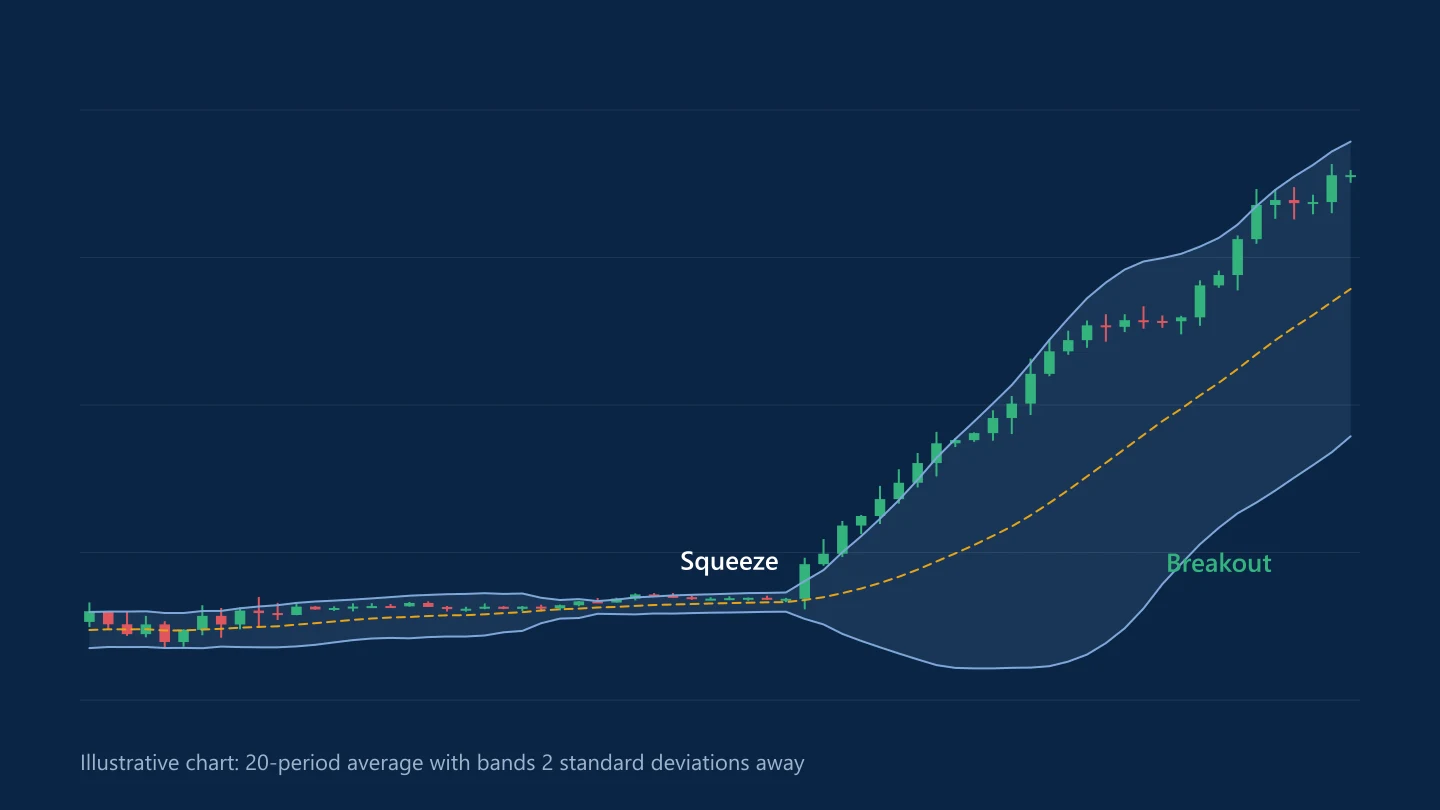
Bollinger Bands explained: the squeeze, band walks and mean reversion
Bollinger Bands wrap a moving average in two volatility bands. Learn how they're calculated, what a squeeze means and why touching a band isn't a signal on its own.
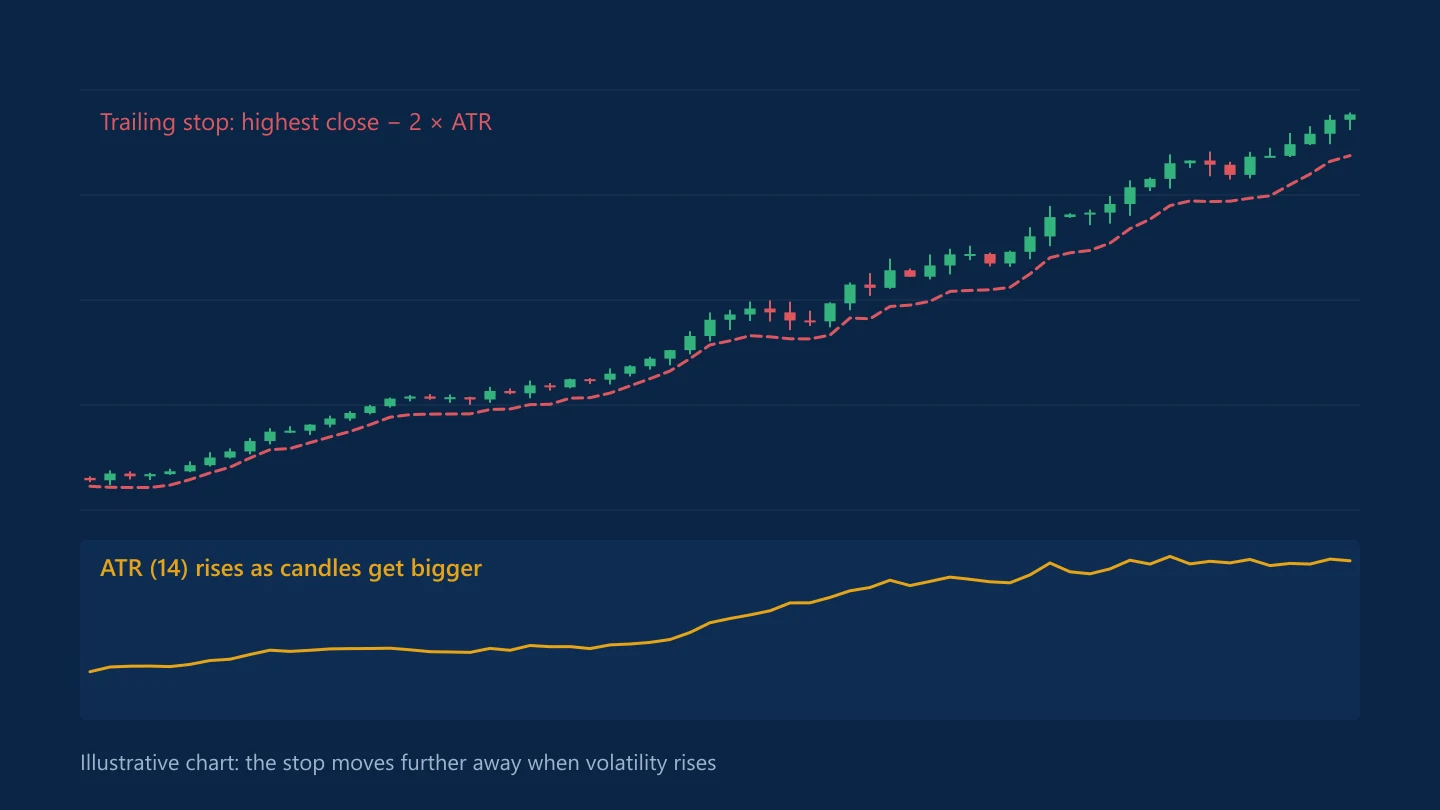
Average true range (ATR): measuring volatility and setting stops
ATR shows how far a pair typically moves in a period. Here is how true range is calculated, and how traders use ATR to place stops and size positions.
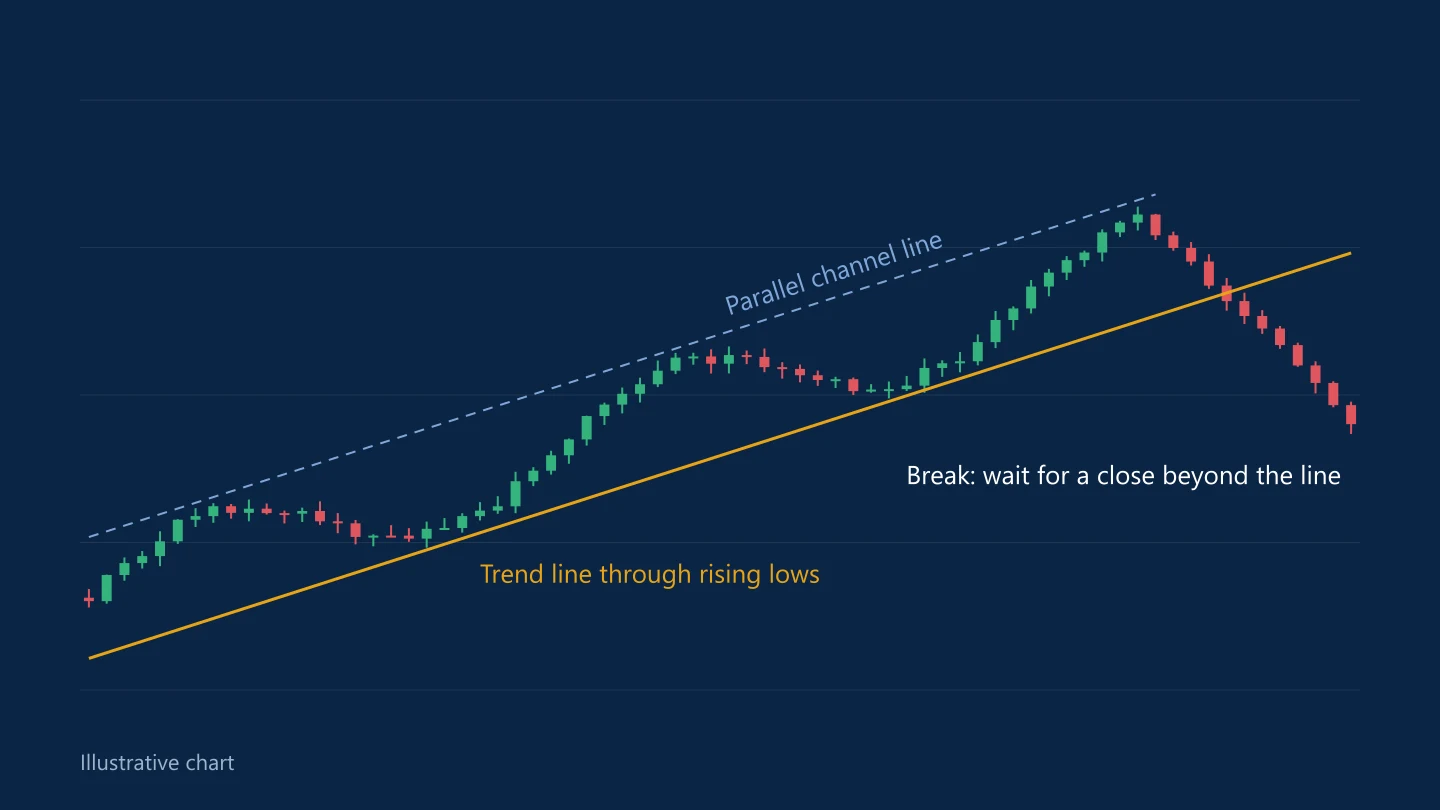
Trend lines and price channels: how to draw them and read a break
A trend line connects rising lows or falling highs. This guide covers drawing trend lines consistently, adding a channel line, and what a break does and doesn't tell you.