The RSI indicator explained: overbought, oversold and divergence
The Relative Strength Index measures how strong recent moves have been. How it is calculated, what 70 and 30 really mean and why RSI can stay extreme in a trend.
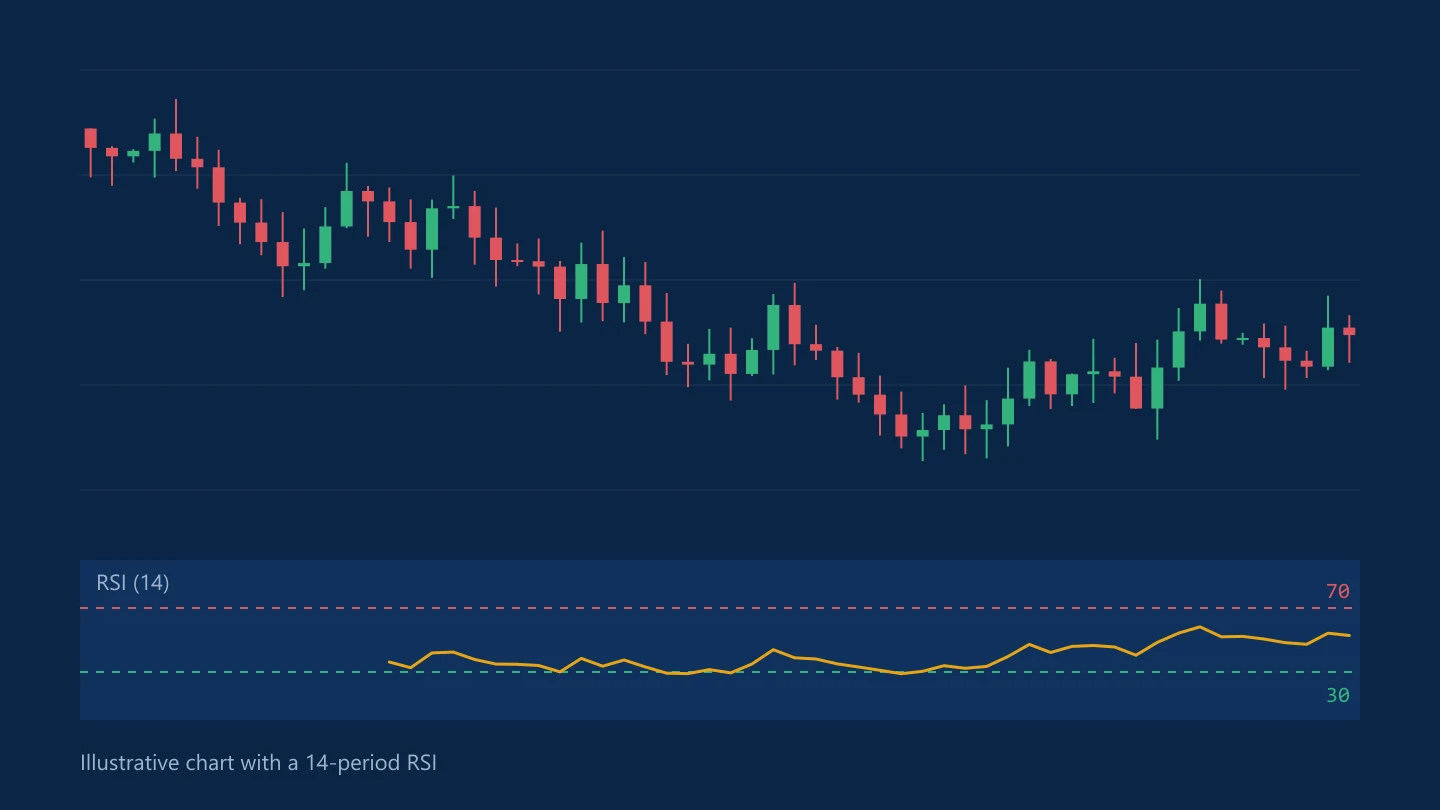
The Relative Strength Index, or RSI, is a momentum indicator that moves between 0 and 100. It was introduced by J. Welles Wilder in his 1978 book New Concepts in Technical Trading Systems, and it is built into almost every charting platform.
How it is calculated
- Over a set number of periods, usually 14, find the average gain on up periods and the average loss on down periods.
- Divide the average gain by the average loss. This is the relative strength, RS.
- RSI = 100 − 100 ÷ (1 + RS).
When recent gains dominate, RSI rises towards 100. When losses dominate, it falls towards 0. Wilder used a smoothed average, so RSI changes gradually rather than jumping with each candle.
Overbought and oversold
The standard levels are:
- Above 70: overbought
- Below 30: oversold
These labels mislead many beginners. "Overbought" doesn't mean the price must fall. It means the recent rise has been strong compared with recent declines. In a powerful trend, RSI can stay above 70 or below 30 for a long time while the price keeps going.
Divergence
Divergence is when price and RSI disagree:
- Bearish divergence: the price makes a higher high, but RSI makes a lower high. The latest push up had less momentum.
- Bullish divergence: the price makes a lower low, but RSI makes a higher low.
Divergence can warn that a move is losing strength, but it often appears several times before a trend actually turns.
Other ways traders use RSI
- The 50 line: RSI holding above 50 is consistent with an uptrend, below 50 with a downtrend.
- Adjusted levels in trends: some traders use 40 and 80 in uptrends, or 20 and 60 in downtrends.
- Different periods: shorter periods make RSI more sensitive; longer periods make it smoother.
Keep it in context
RSI summarises past prices; it doesn't know that the Fed is announcing a decision in an hour. Readings are most useful alongside price structure, such as support and resistance, and a clear plan for risk per trade.
Common questions
What does RSI above 70 mean?
That recent gains have been strong compared with recent losses. It is called overbought, but in a strong uptrend the price can keep rising while RSI stays above 70.
What is the best RSI setting?
The standard is 14 periods, as Wilder proposed. Shorter settings react faster with more false signals; longer settings are smoother. There is no single best setting.
This article is for information only and is not financial advice. Trading forex and CFDs carries a high risk of losing money. Read the risk warning. Spotted an error? Tell the editors.
Comments
Log in to join the discussion. Comments follow the community guidelines.
Log in to commentLoading comments…