Fibonacci retracements explained: the 38.2%, 50% and 61.8% levels
How traders draw Fibonacci retracement levels across a price swing, where the ratios come from, and why the levels work best as zones alongside other evidence.
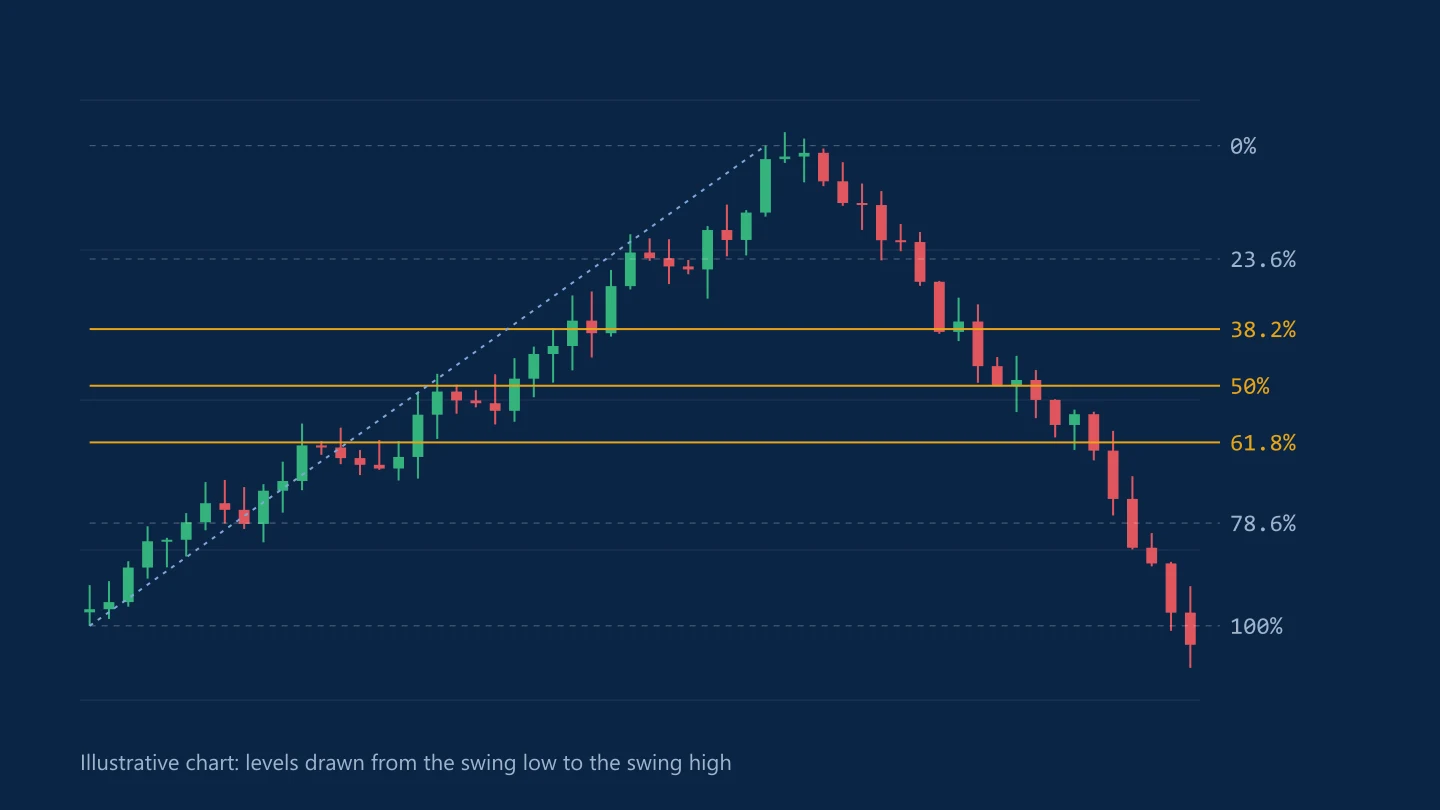
A Fibonacci retracement tool divides a completed price swing into proportions and marks them as horizontal levels. Traders use the levels to judge how far a pullback might run before the original move resumes. The tool is on every charting platform, which is part of why the levels get attention: a lot of people are watching the same lines.
Where the ratios come from
The Fibonacci sequence runs 0, 1, 1, 2, 3, 5, 8, 13, 21, 34, 55, 89, with each number the sum of the two before it. Divide a number by the next one and the result settles near 0.618. Divide it by the number two places later and you get about 0.382; three places later, about 0.236.
The levels most platforms draw by default are:
- 23.6%: a shallow pullback in a strong trend
- 38.2%: a common pullback in a healthy trend
- 50%: not a Fibonacci ratio at all, but included because traders watch halfway points
- 61.8%: a deep pullback; beyond it, many traders start to doubt the trend
- 78.6%: the square root of 0.618, the last common level before the whole swing is erased
Nothing shows that markets obey these ratios for a mathematical reason. Treat them as reference points that many participants share, not as laws.
How to draw the levels
- Find a clear, completed swing: a swing low followed by a swing high in an uptrend, or a high followed by a low in a downtrend.
- Anchor the tool at the start of the swing and drag it to the end.
- Read the levels as a map of how deep a pullback has gone.
A hypothetical example on EUR/USD: price rallies from 1.1000 to 1.1200, a 200-pip swing. The 38.2% retracement sits about 76 pips below the high, near 1.1124. The 50% level is 1.1100 and the 61.8% level is near 1.1076.
Using the levels without fooling yourself
- Pick swings consistently. Move an anchor point and every level moves with it. Decide in advance whether you anchor on wicks or closes.
- Look for confluence. A retracement level that lines up with earlier support or resistance, a round number or a moving average carries more weight than a line on its own.
- Treat levels as zones. Price often overshoots a level by a few pips before turning, so a stop placed exactly on the line is easy to trigger.
- Wait for a reaction. A level tells you where to pay attention, not what will happen. A rejection candle or a break of a short-term swing is evidence; the level alone isn't.
Extensions and hindsight
The same tool projects extensions beyond the swing, commonly at 127.2% and 161.8%, which some traders use as profit targets. Be wary of charts shared online where every turn lands on a Fibonacci line. With five or more levels on screen, something will always look like it fits after the fact. Test the tool on past charts with fixed rules before relying on it, and size positions so a failed level costs a planned amount (see position sizing).
Common questions
What are the main Fibonacci retracement levels?
23.6%, 38.2%, 50%, 61.8% and 78.6% of the prior price swing. The 50% level isn't a Fibonacci ratio but is included because traders watch halfway points.
Do you draw Fibonacci from high to low or low to high?
In an uptrend, from the swing low to the swing high; in a downtrend, from the swing high to the swing low. The levels then show how far a pullback has retraced the move.
Does the 61.8% Fibonacci level work?
No level works on its own. Fibonacci levels are reference points many traders share, and they are more useful when they line up with other support or resistance and when price shows a reaction there.
This article is for information only and is not financial advice. Trading forex and CFDs carries a high risk of losing money. Read the risk warning. Spotted an error? Tell the editors.
Comments
Log in to join the discussion. Comments follow the community guidelines.
Log in to commentLoading comments…