Moving averages explained: SMA and EMA
Moving averages smooth out price noise to show the trend. How simple and exponential averages are calculated, which periods traders use and where they fail.
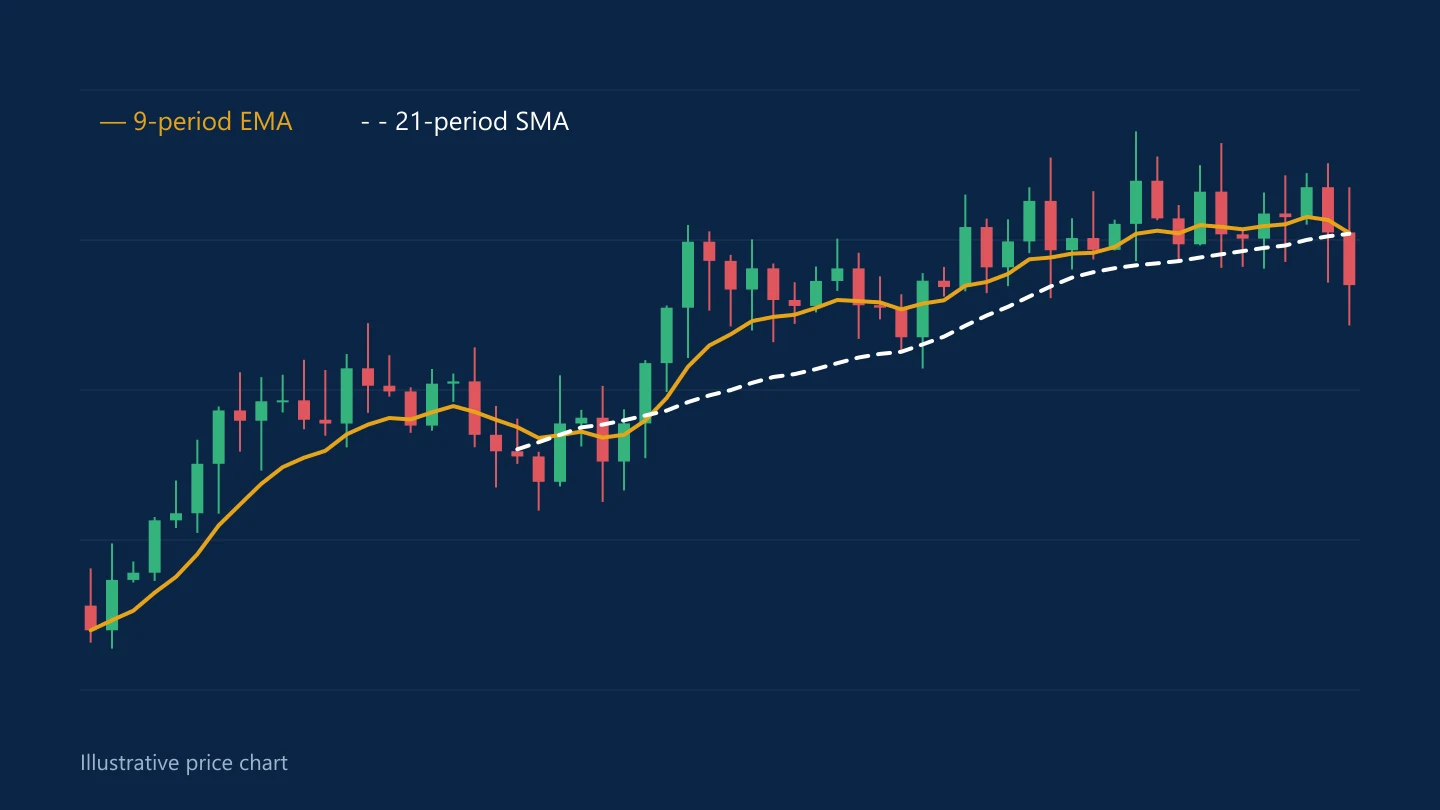
A moving average plots the average price over a set number of past periods, updated with each new candle. It turns a jagged price chart into a smoother line that makes the trend easier to see.
Simple moving average (SMA)
The SMA adds up the closing prices of the last N periods and divides by N. A 20-period SMA on a daily chart is the average close of the last 20 days. Each day, the newest close is added and the oldest one drops out.
Exponential moving average (EMA)
The EMA gives more weight to recent prices, so it reacts faster to new moves. Each new value is calculated from the latest close and the previous EMA, using a weighting factor of 2 ÷ (N + 1). For a 20-period EMA, the latest close gets a weight of about 9.5%.
SMA or EMA?
- The EMA turns sooner, which helps catch new trends but produces more false signals.
- The SMA is steadier, which filters noise but lags more.
Neither is better in general; it depends on how quickly you want the line to respond.
Periods traders commonly use
- 20: short-term trend
- 50: medium-term trend
- 100 and 200: long-term trend, especially on daily charts
The 200-day average is widely followed, which makes it a level where the price often reacts.
Common ways to use them
- Trend direction: price above a rising average suggests an uptrend; below a falling average suggests a downtrend.
- Dynamic support and resistance: in trends, prices often pull back to a moving average before continuing.
- Crossovers: when a faster average crosses above a slower one, such as the 50 over the 200, some traders read it as a bullish shift. The opposite is read as bearish.
Where moving averages fail
All moving averages are calculated from past prices, so they lag. In sideways markets, prices cross back and forth through the average and crossovers fire repeatedly without a trend developing. They are most useful when combined with price levels, such as support and resistance, and with an understanding of what is driving the market.
Common questions
What is the difference between SMA and EMA?
An SMA weights every period equally. An EMA gives more weight to recent prices, so it responds faster to new moves but can give more false signals.
What is a golden cross?
When a shorter moving average, typically the 50-period, crosses above a longer one, typically the 200-period. Many traders read it as a sign of a strengthening uptrend.
This article is for information only and is not financial advice. Trading forex and CFDs carries a high risk of losing money. Read the risk warning. Spotted an error? Tell the editors.
Comments
Log in to join the discussion. Comments follow the community guidelines.
Log in to commentLoading comments…