Support and resistance: how traders mark price levels
Support and resistance are the most widely used ideas in chart reading. How to find levels, why they work as zones, and what happens when they break.
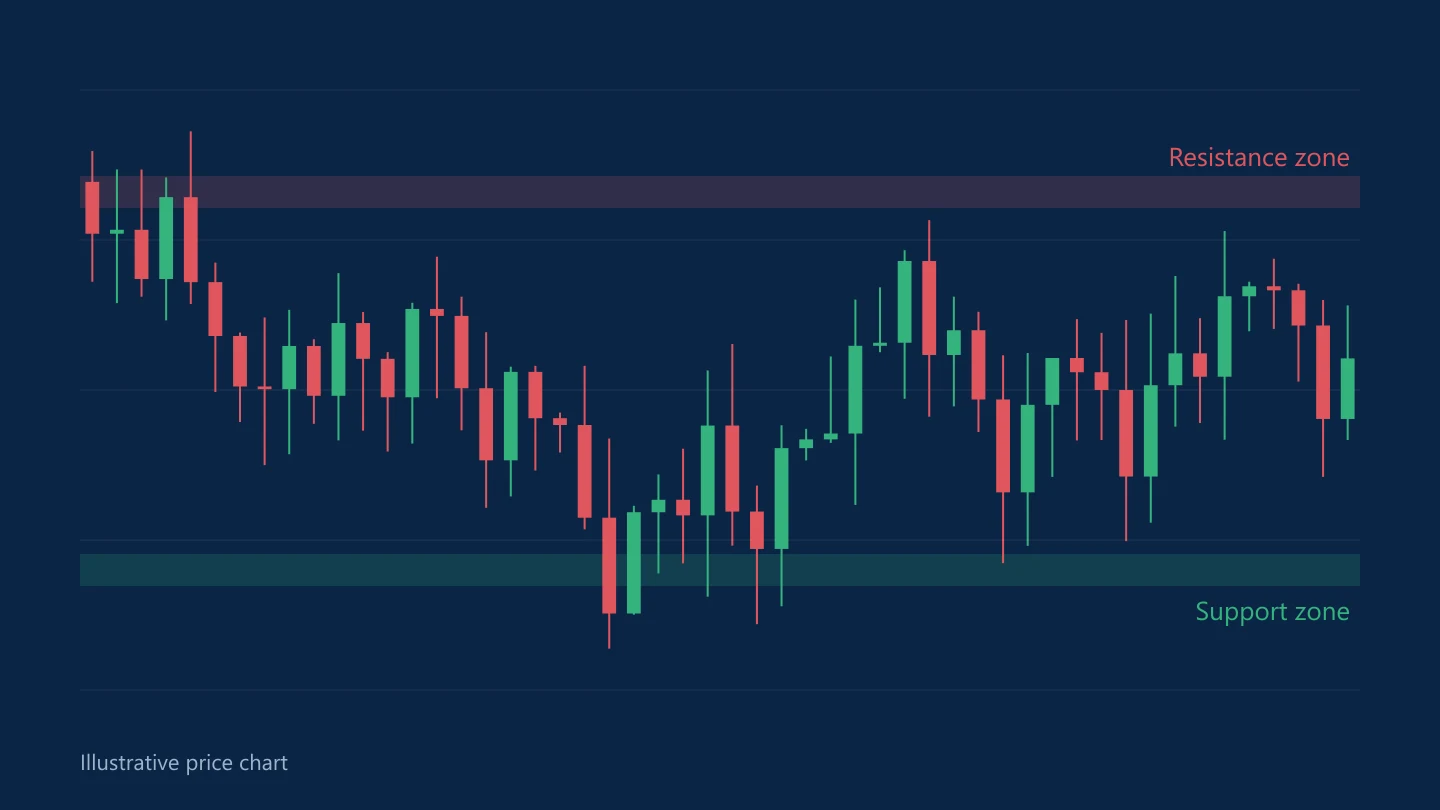
Support is a price area where falling prices have tended to stop. Resistance is an area where rising prices have tended to stall. The idea is simple, and because so many traders use it, it can become partly self-fulfilling.
Why levels form
Traders remember prices. If EUR/USD bounced strongly from 1.1400 last month, buyers who missed that move may place orders there again, and sellers who shorted too low may close their positions there. Orders cluster, and the price reacts.
Where to find them
- Previous highs and lows, especially on daily and weekly charts
- Round numbers, such as 1.1500 on EUR/USD or 150.00 on USD/JPY
- Areas where the price has turned several times
- The previous day's and week's high and low, which many intraday traders watch
Zones, not lines
Prices rarely turn at exactly the same tick. Marking a zone a few pips wide is more realistic than a single line, and it helps avoid placing stops exactly where everyone else's stops are.
Role reversal
When support breaks, it often becomes resistance on a later rally, and broken resistance often becomes support. Traders who bought at the old support and are now losing money may sell to break even when the price returns there.
Breakouts and false breakouts
A move through a level can be the start of a new trend or a trap:
- A breakout tends to be more convincing when a candle closes beyond the level on a higher timeframe.
- A false breakout pushes through the level, triggers stops, and then reverses back inside the range.
False breakouts are common around round numbers and in the minutes after data releases.
Using levels in a plan
- Place stop-losses beyond a zone, not inside it.
- Expect reactions at levels, but don't assume they will hold.
- Combine a level with something else before acting, such as a candlestick signal or a moving average.
- Size the position for the distance to your stop; see position sizing.
No level is guaranteed to hold. Central bank decisions and surprises in economic data can carry the price through any line on a chart.
Common questions
What is support and resistance in forex?
Support is a price area where falling prices have tended to stop, and resistance is an area where rising prices have tended to stall, often because many orders cluster there.
What happens when support breaks?
The price often falls further, and the old support level frequently acts as resistance if the price comes back up to it.
This article is for information only and is not financial advice. Trading forex and CFDs carries a high risk of losing money. Read the risk warning. Spotted an error? Tell the editors.
Comments
Log in to join the discussion. Comments follow the community guidelines.
Log in to commentLoading comments…