Bollinger Bands explained: the squeeze, band walks and mean reversion
Bollinger Bands wrap a moving average in two volatility bands. Learn how they're calculated, what a squeeze means and why touching a band isn't a signal on its own.
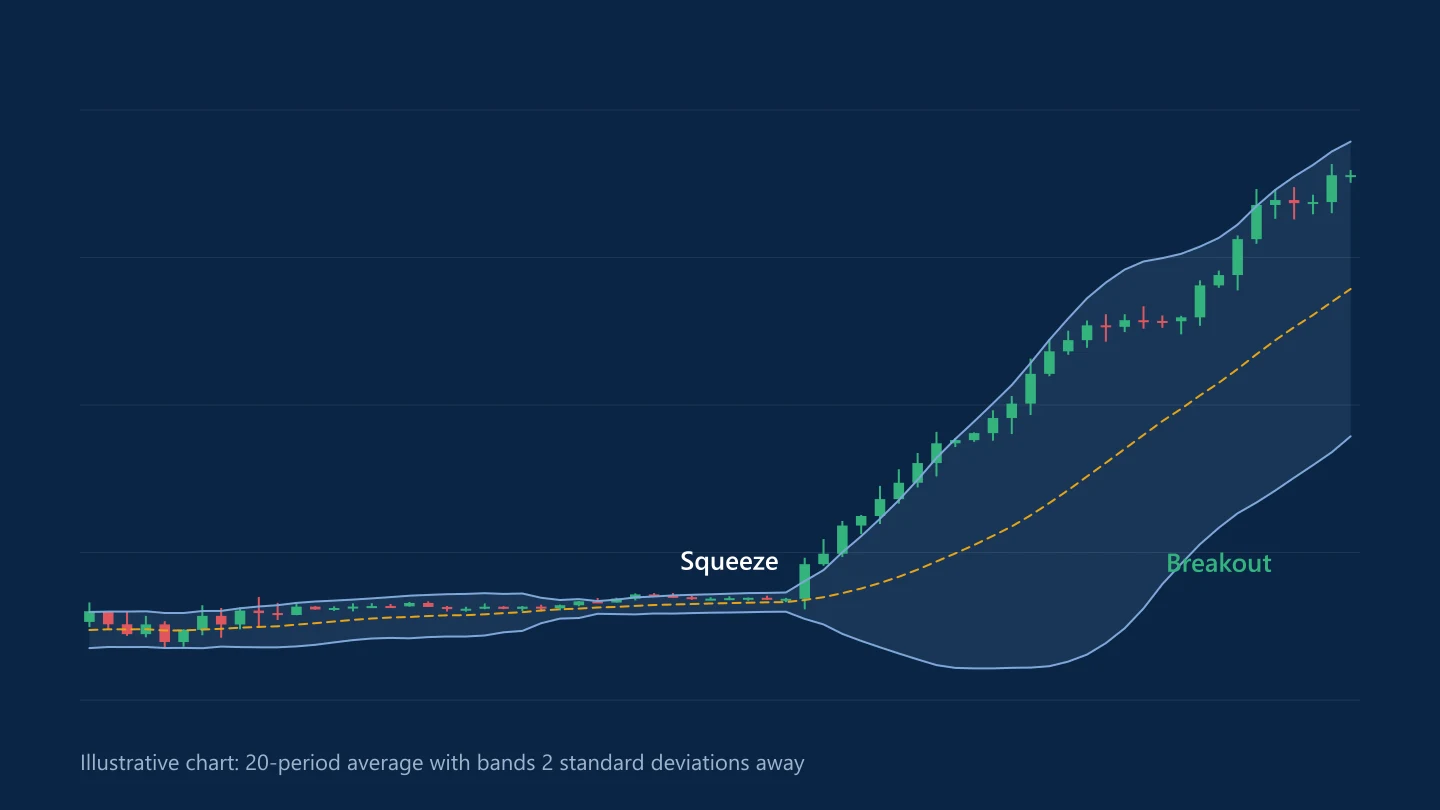
Bollinger Bands were developed by John Bollinger in the 1980s. They place a band above and below a moving average at a distance set by recent volatility, so the bands widen when prices swing more and narrow when the market goes quiet.
How the bands are calculated
The default settings are 20 periods and 2 standard deviations:
- Middle band: the 20-period simple moving average of closing prices
- Upper band: the middle band plus 2 × the standard deviation of the last 20 closes
- Lower band: the middle band minus 2 × that standard deviation
Standard deviation measures how spread out prices are around their average. Because it grows with volatility, the bands adapt on their own: a quiet Asian session produces tight bands, while a payrolls release can blow them wide open.
Three things traders watch
The squeeze
When the bands contract to their narrowest in months, volatility is unusually low. Quiet periods tend not to last, so a squeeze warns that a bigger move may be coming. It doesn't say which direction. Traders usually wait for a close outside the bands or a break of a range.
Walking the band
In a strong trend, price can hug the upper or lower band for many candles. Repeated touches of the upper band in an uptrend show strength, not an automatic reason to sell. Selling every touch in a trend is one of the most common ways to lose money with this indicator.
Reversion to the middle
In a range, price that stretches to one band often drifts back toward the middle band. That works while the range holds and fails badly when a breakout starts, so range traders need a stop beyond the band and a clear idea of when the range is over.
Practical notes
- A close outside a band is information, not a signal. Combine it with levels, candle patterns or a trend filter.
- The bands are calculated from closes, so wicks often poke through them. A close back inside can matter more than the poke.
- Bandwidth, the distance between the bands divided by the middle band, turns the squeeze into a number you can compare with earlier periods.
- Changing the multiplier from 2 changes how often price leaves the bands. Keep the default until you have a tested reason to change it.
Bollinger Bands pair naturally with a volatility-based stop such as average true range, because both measure how far price normally moves.
Common questions
What are the standard Bollinger Bands settings?
A 20-period simple moving average, with bands 2 standard deviations above and below it.
Is touching the upper Bollinger Band a sell signal?
Not on its own. In a strong uptrend price can ride the upper band for a long time. A touch shows price is stretched relative to recent volatility, which needs other evidence before it becomes a trade.
What is a Bollinger squeeze?
A period when the bands narrow sharply because volatility is low. It often comes before a bigger move, but it doesn't show which direction the move will take.
This article is for information only and is not financial advice. Trading forex and CFDs carries a high risk of losing money. Read the risk warning. Spotted an error? Tell the editors.
Comments
Log in to join the discussion. Comments follow the community guidelines.
Log in to commentLoading comments…