Average true range (ATR): measuring volatility and setting stops
ATR shows how far a pair typically moves in a period. Here is how true range is calculated, and how traders use ATR to place stops and size positions.
Average true range, or ATR, measures how much a market typically moves in one period. It says nothing about direction. J. Welles Wilder Jr. introduced it in his 1978 book New Concepts in Technical Trading Systems, the same book that introduced the RSI.
True range, then the average
For each candle, true range is the largest of three distances:
- the current high minus the current low
- the current high minus the previous close, ignoring the sign
- the current low minus the previous close, ignoring the sign
The second and third measures capture gaps. If a pair closes on Friday at one price and reopens well away from it, the high-to-low range of the next candle alone would understate the move (see weekend gaps).
ATR averages true range, usually over 14 periods using Wilder's smoothing. It's expressed in price, so a daily ATR of 0.0060 on GBP/USD means the pair has recently been moving about 60 pips a day.
Using ATR for stop distance
A stop inside normal day-to-day noise gets hit by random movement, and ATR gives a rough measure of that noise. Common approaches:
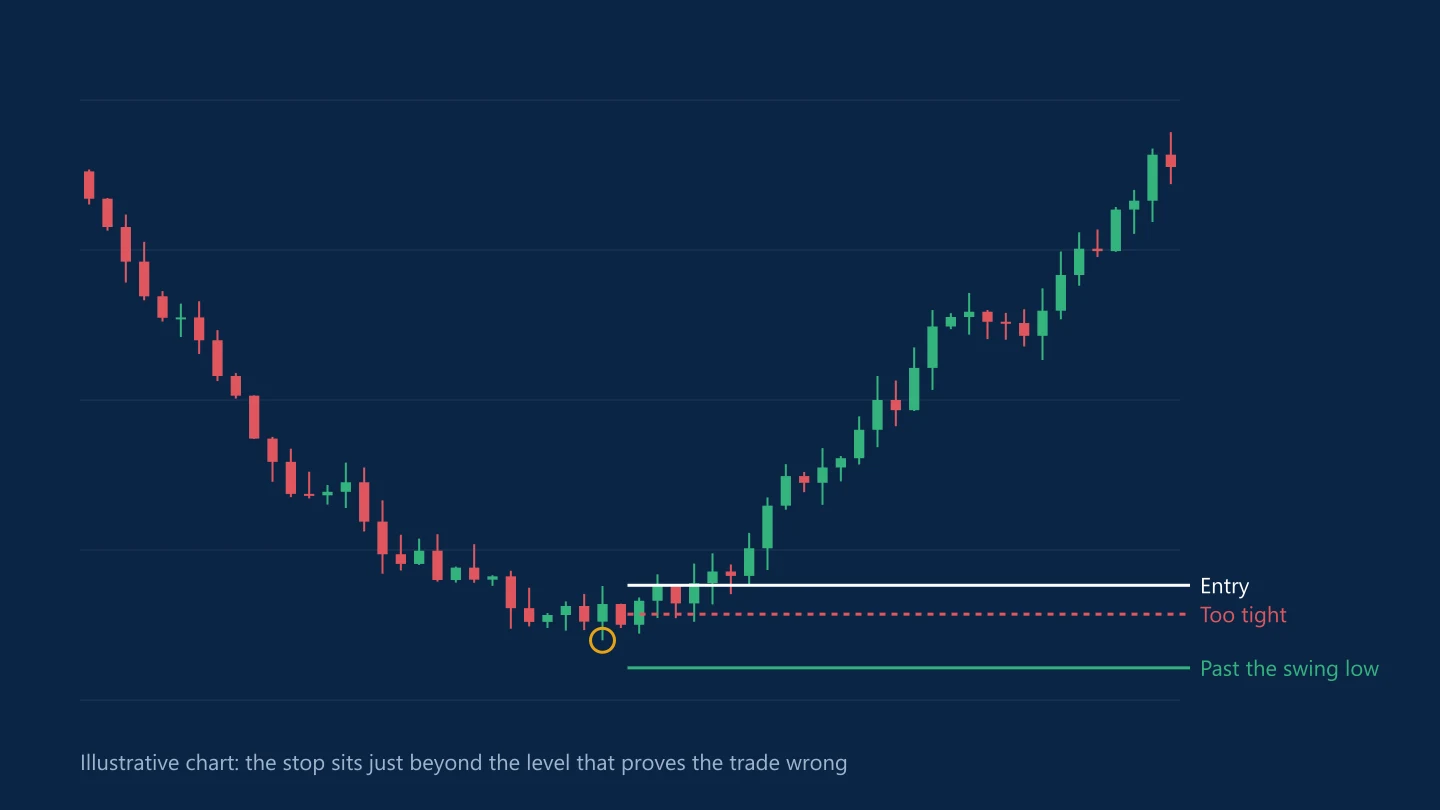
- A multiple of ATR: the stop sits 1.5 or 2 ATRs from the entry, or beyond a swing level plus a fraction of ATR.
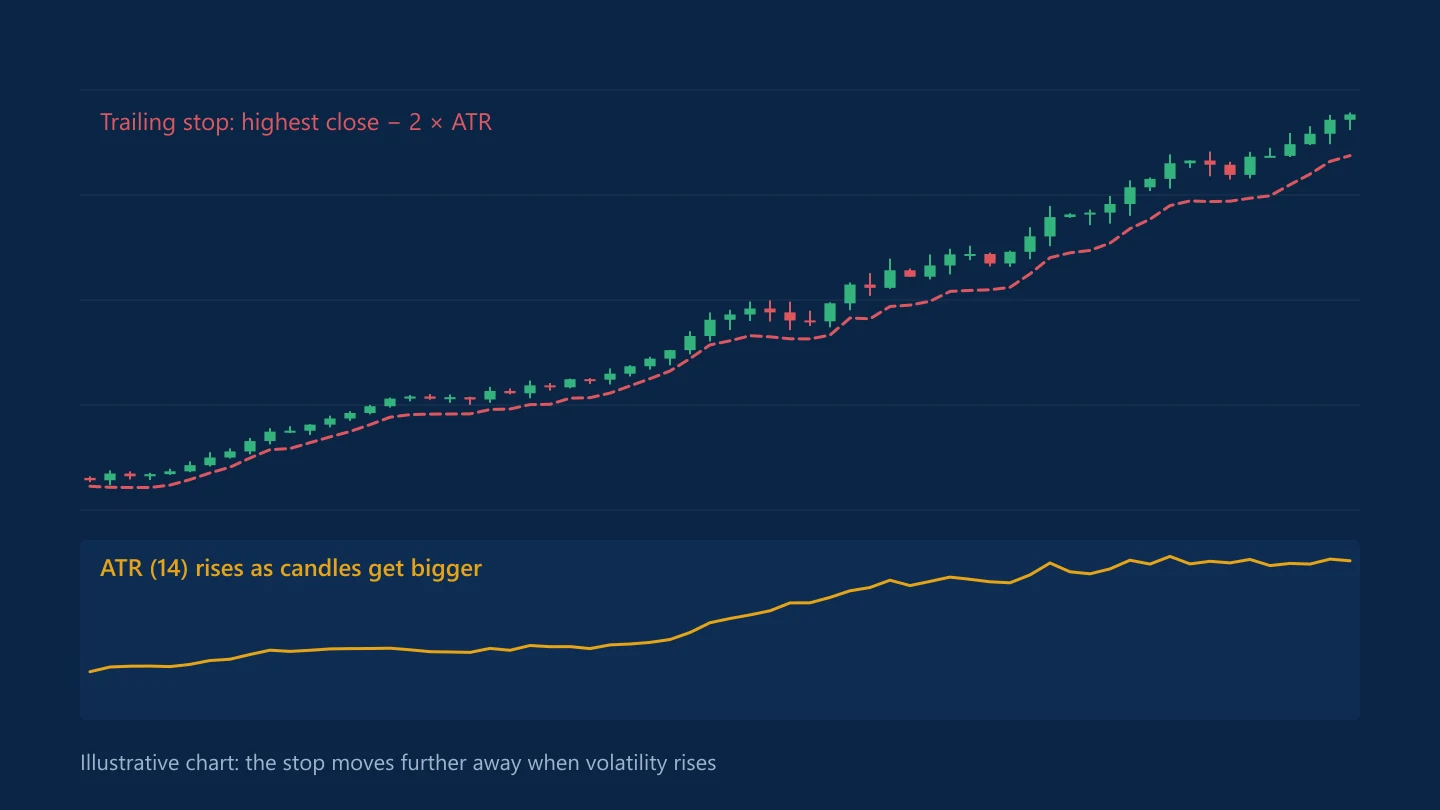
- A trailing ATR stop: the stop trails a fixed number of ATRs behind the highest close in an uptrend, so it widens when volatility rises and tightens when it falls.
The multiple is a trade-off. Wider stops are hit less often but lose more when they are, so the position has to shrink to keep the money at risk the same.
ATR and position size, with numbers
Take a hypothetical $10,000 account risking 1% per trade, or $100. Daily ATR on GBP/USD is 60 pips, and the rule is a stop of 1.5 ATRs: 90 pips. On a US dollar account, GBP/USD is worth about $10 a pip per standard lot, so a 90-pip stop costs $900 per lot. $100 ÷ $900 gives 0.11 lots.
If volatility doubles and ATR reaches 120 pips, the same rule gives a 180-pip stop and about 0.05 lots. The $100 at risk doesn't change; only the position size does. That's the main benefit of using ATR: volatility changes the size, not the risk. The full method is in position sizing.
What ATR doesn't do
- It doesn't forecast direction or tell you when to enter.
- It jumps after big news and takes time to settle, so a stop based on a spike can be wider than it needs to be.
- It describes the recent past. Ahead of central bank decisions or major data, the moves that follow can be larger than ATR suggests.
Common questions
How is ATR calculated?
True range for each period is the largest of high minus low, high minus the previous close, and low minus the previous close, ignoring signs. ATR averages true range, typically over 14 periods with Wilder's smoothing.
What ATR multiple should I use for a stop-loss?
Many traders use 1.5 to 2 times ATR, but there is no correct number. Wider stops are hit less often and need a smaller position to keep the same amount of money at risk.
Does ATR show the direction of the trend?
No. ATR measures how much price moves, not which way it moves.
This article is for information only and is not financial advice. Trading forex and CFDs carries a high risk of losing money. Read the risk warning. Spotted an error? Tell the editors.
Comments
Log in to join the discussion. Comments follow the community guidelines.
Log in to commentLoading comments…