The MACD indicator explained: signal line, histogram and divergence
MACD measures the gap between two exponential moving averages. Here is how the line, signal line and histogram are calculated, and the ways traders read them.
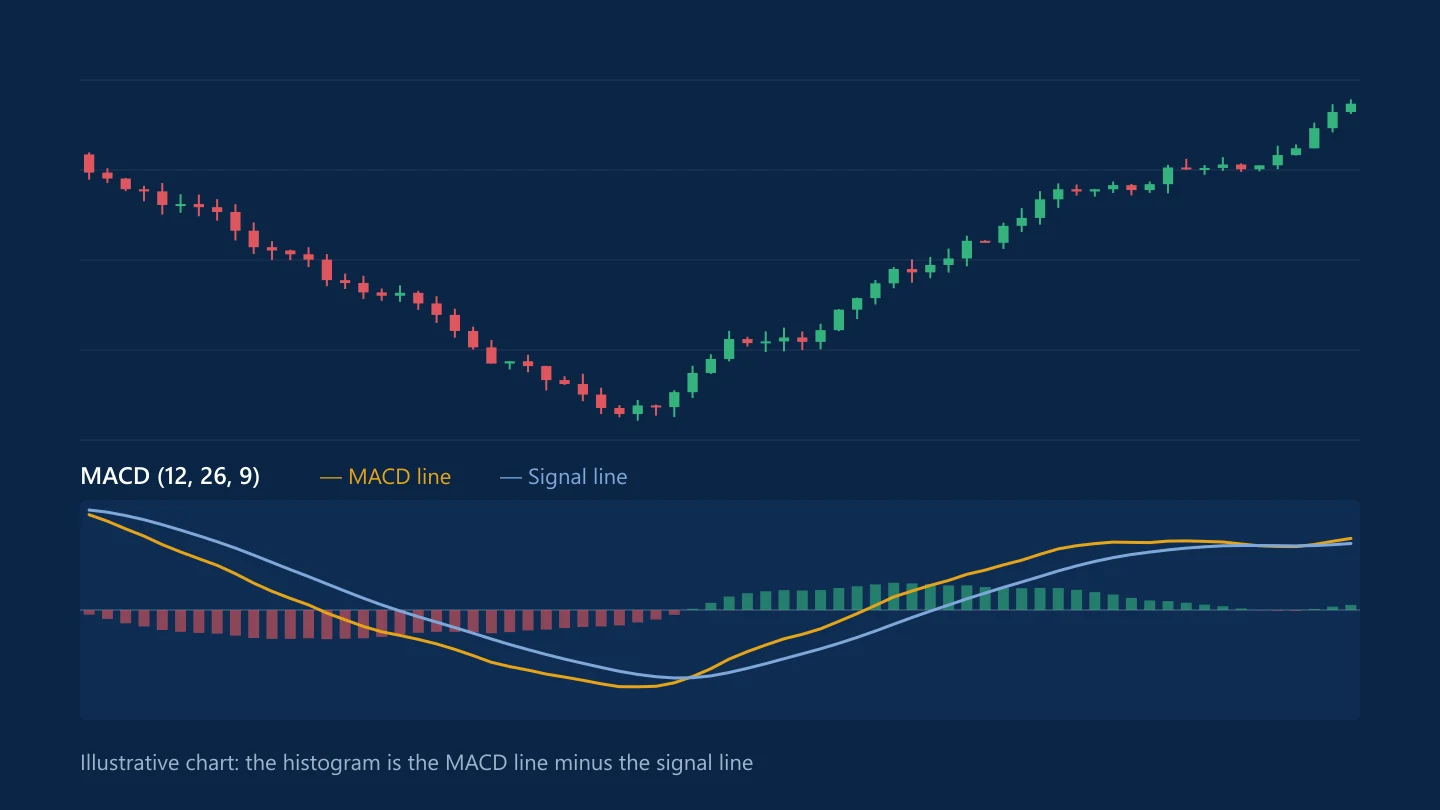
MACD, short for moving average convergence divergence, is a momentum indicator developed by Gerald Appel in the late 1970s. It shows whether two exponential moving averages are pulling apart or coming together, which traders read as momentum building or fading.
How MACD is calculated
With the standard settings of 12, 26 and 9:
- MACD line = the 12-period EMA of closing prices minus the 26-period EMA
- Signal line = a 9-period EMA of the MACD line
- Histogram = the MACD line minus the signal line
When the faster average is above the slower one, the MACD line is positive, and it rises as the gap widens. The histogram measures the distance between MACD and its own signal line, so it shrinks toward zero before the two lines cross. For how exponential averages differ from simple ones, see moving averages explained.
Three common ways to read it
Signal line crossovers
The MACD line crossing above its signal line is read as bullish momentum; crossing below, bearish. Crossovers are frequent, and in a sideways market many of them lead nowhere.
Zero line crossovers
The MACD line crosses zero when the 12- and 26-period EMAs cross each other. It's a slower signal that some traders use as a trend filter, for example only looking for buys while MACD is above zero.
Divergence
Bearish divergence is when price makes a higher high but MACD makes a lower high, suggesting the push behind the move is weakening. Bullish divergence is the mirror image. Divergence can persist for a long time in a strong trend, so it's a reason to tighten risk rather than, on its own, a reason to trade against the trend.
Limits to keep in mind
- It lags. Every input is an average of past prices, so MACD confirms moves after they've started.
- Readings aren't comparable across markets. MACD is measured in price units, so a reading on USD/JPY looks nothing like one on EUR/USD. Unlike the RSI, it has no fixed overbought or oversold levels.
- Settings change everything. Shorter settings react faster and give more false signals. Whatever you choose, test it before trading it.
MACD works best as one piece of evidence among several. A crossover in the direction of the higher time frame's trend, near a level you had already marked, means more than a crossover in the middle of a range.
Common questions
What do the MACD settings 12, 26 and 9 mean?
The MACD line is the 12-period exponential moving average minus the 26-period one, and the signal line is a 9-period exponential moving average of the MACD line.
What is a MACD crossover?
When the MACD line crosses its signal line. Crossing above is read as bullish momentum and below as bearish, but crossovers give many false signals in sideways markets.
What does the MACD histogram show?
The difference between the MACD line and the signal line. It shrinks toward zero before the two lines cross, so traders use it to see momentum changing early.
This article is for information only and is not financial advice. Trading forex and CFDs carries a high risk of losing money. Read the risk warning. Spotted an error? Tell the editors.
Comments
Log in to join the discussion. Comments follow the community guidelines.
Log in to commentLoading comments…