Trend lines and price channels: how to draw them and read a break
A trend line connects rising lows or falling highs. This guide covers drawing trend lines consistently, adding a channel line, and what a break does and doesn't tell you.
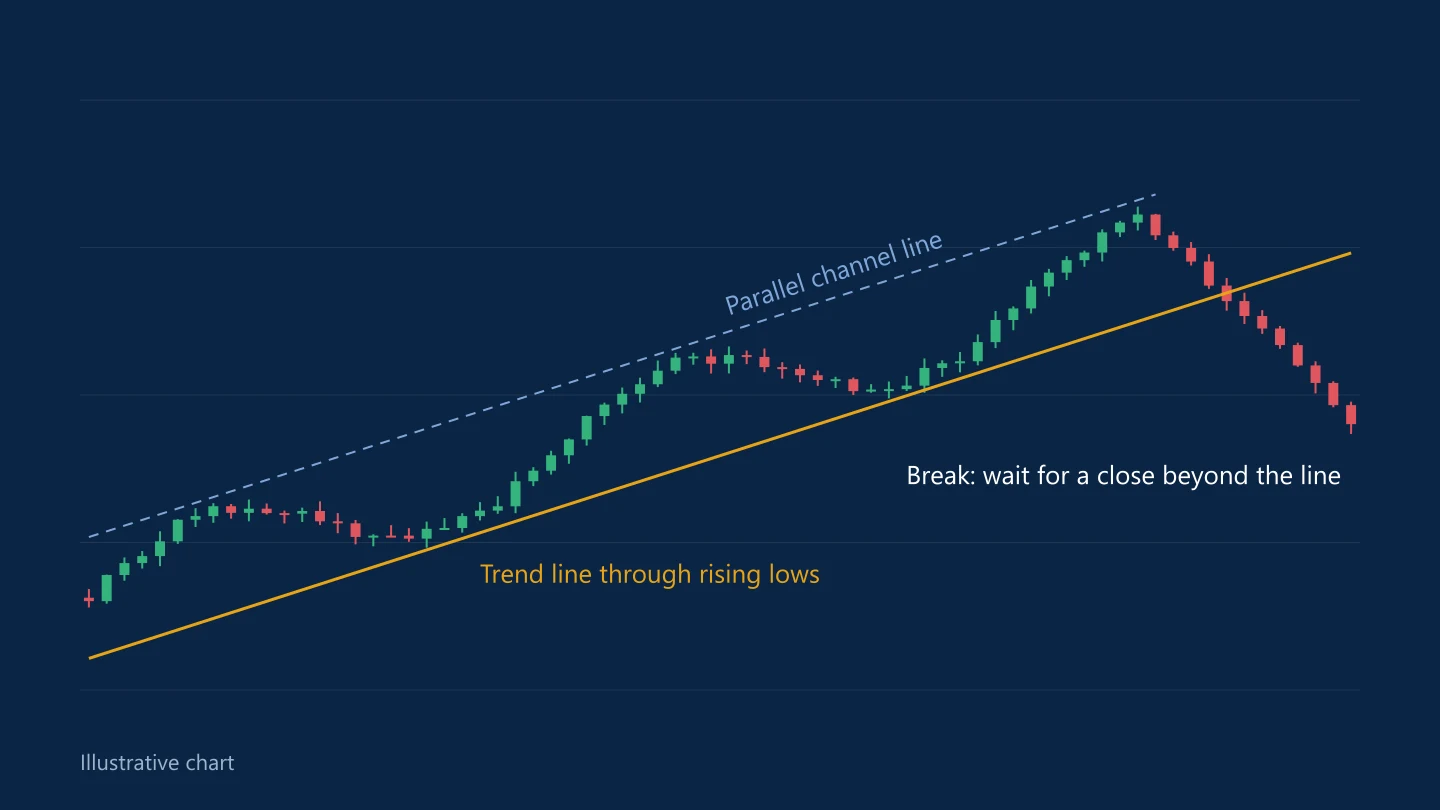
A trend line is the simplest tool in technical analysis: a straight line through a series of rising lows or falling highs. It shows the slope of a trend and gives a reference for where pullbacks have been meeting buyers or sellers.
Drawing a trend line
- Uptrend: connect at least two rising swing lows and extend the line to the right. While price stays above it, the trend is intact.
- Downtrend: connect at least two falling swing highs.
- Confirmation: two points make a line. A third touch that holds suggests other traders are watching it too.
Be consistent about what you connect. Using wicks on one chart and closing prices on another produces different lines, and nudging a line after each new candle until it "fits" makes it meaningless.
Steep lines break quickly. A line across a sharp two-day rally will be broken by the first ordinary pullback, while a gentler line across weeks of price describes the trend better.
Adding a channel
Draw a parallel copy of the trend line through the opposite swings, over the highs in an uptrend or under the lows in a downtrend, and you have a channel. Some traders use the far side of the channel as a profit target or as a sign that a move is stretched. When price stops reaching the channel line, momentum may be fading.
Reading a break
A broken trend line doesn't automatically mean a reversal. It can lead to:
- a reversal, confirmed when price makes a lower high after breaking an uptrend line
- a sideways range, where the trend pauses
- a slower trend, which needs a new, flatter line
Traders cut down false breaks by waiting for a candle to close beyond the line, looking for a retest of the broken line from the other side, or waiting for the swing structure itself to change. Each filter gives up some price in exchange for fewer false signals.
Where trend lines fit
Trend lines work best alongside horizontal support and resistance. A pullback that reaches both a rising trend line and a former resistance level gives a clearer place to act, and a clearer place for the stop if the idea is wrong. For patterns built from lines like these, see head and shoulders and double tops.
Common questions
How many points do you need to draw a trend line?
Two swing points define the line. A third touch that holds gives it more weight, because it shows other traders are reacting to the same line.
Should trend lines use wicks or candle bodies?
Either can work, as long as you use the same method every time and don't redraw the line to fit each new candle.
Does a broken trend line mean the trend has reversed?
Not necessarily. A break can lead to a reversal, a sideways range or a slower trend. Many traders wait for a close beyond the line, a retest, or a change in the swing highs and lows before acting.
This article is for information only and is not financial advice. Trading forex and CFDs carries a high risk of losing money. Read the risk warning. Spotted an error? Tell the editors.
Comments
Log in to join the discussion. Comments follow the community guidelines.
Log in to commentLoading comments…