Which indicators did you stop using, and why?
Many traders go through a phase of stacking indicators until the chart is unreadable, then strip most of them away. We're interested in what you removed and what you kept.
Good replies explain:
- the indicator and how you were using it
- what made you drop it: lag, conflicting signals, or realising it added nothing to price itself
- what replaced it, if anything
For reference, the site has guides to moving averages, RSI, MACD and Bollinger Bands.
Comments
Log in to join the discussion. Comments follow the community guidelines.
Log in to commentLoading comments…
A pattern worth checking before dropping or adding an indicator: many popular indicators are calculated from the same closing prices, so they tend to agree with each other.
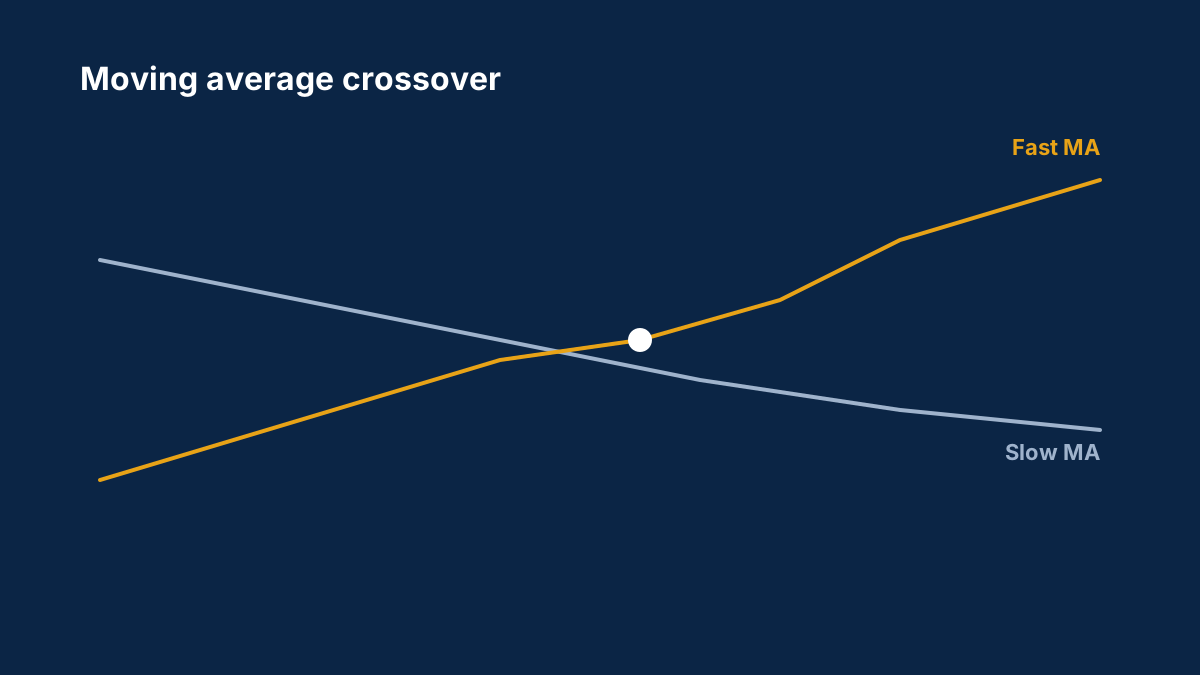
- Moving averages, MACD and momentum all measure direction and speed of recent closes. MACD is itself built from two moving averages.
- RSI and stochastics both measure where the latest close sits relative to recent moves.
- Bollinger Bands and ATR both measure volatility, in different ways.
Using three indicators from the same family can feel like confirmation when it's really the same information three times. Traders who simplify often keep one per job: one for trend, one for volatility, perhaps one for momentum.
Guides for each: moving averages, MACD, RSI, Bollinger Bands and ATR.
Members, which indicator did you keep when you cleaned up your charts?
0