What the Fed's September 2026 rate hike means for your trading
The Fed raised rates by a quarter point on 16 September — its first hike since 2023 — and its projections show rates staying near 4% through 2027. Here is what the decision, the dots and the dollar's reaction mean for every pair.
On 16 September 2026 the Federal Reserve raised its target range for the federal funds rate by a quarter point to 3.75%–4.00%, in a unanimous 12–0 vote — the first increase since July 2023, and the decision the entire currency market had been pricing for weeks (report). The hike itself was the expected part. The projections were the news: the committee's updated dots show rates staying near 4% through 2027, a signal that the Fed intends to hold policy tight for years.
This analysis walks through the decision's four parts and what they mean for currency traders. The event mechanics are in the central bank day playbook; the transmission in the Fed hike explainer.
The decision: expected, and therefore small
The hike's market impact was limited by its own predictability. The Fed had telegraphed the move through weeks of communication, the market had priced it, and the decision itself moved the dollar modestly — the textbook behaviour for a fully priced decision. The lesson is the standing one: the rate change is the least informative part of a central bank day. The market trades the surprise, and the surprise lived in the other three parts. The central bank language explainer covers why the words carry more weight than the rate.
The projections: the hawkish core
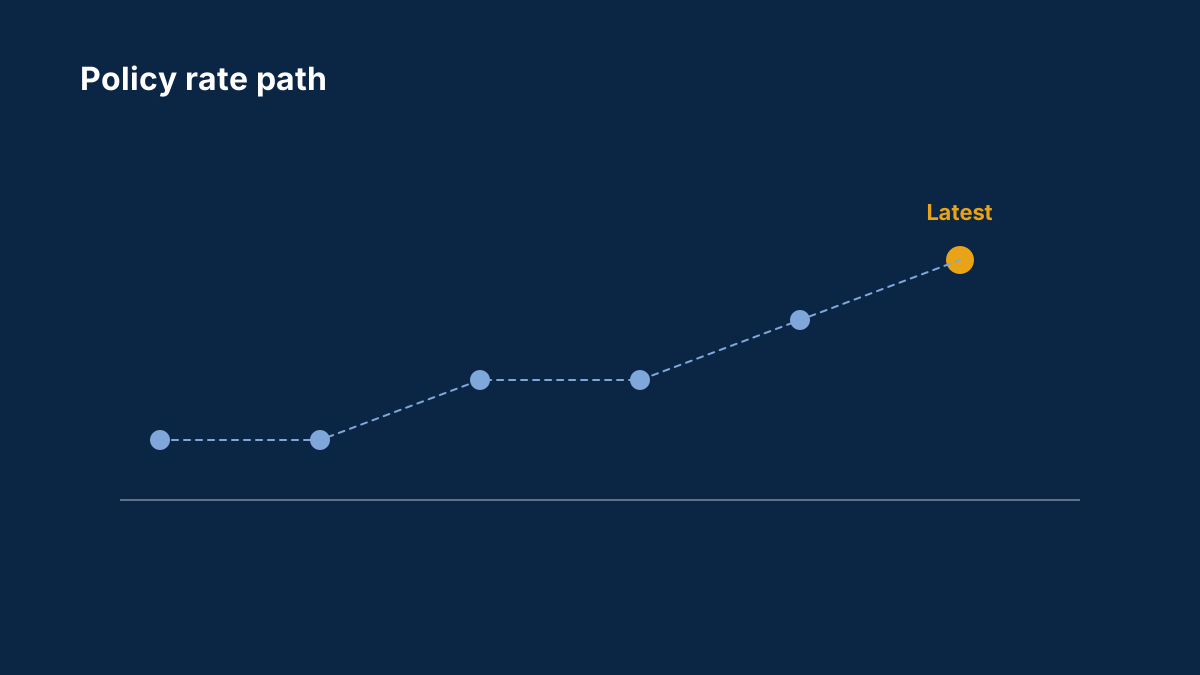
The projections were the decision's real message. The dots show the committee's median expectation keeping rates near 4% through 2027 (report) — a "higher for longer" path that the dollar's reaction priced as hawkish. The dot plot explainer covers how to read the median, the scatter and the longer-run dot; the September plot's message was persistence, and persistence is what the dollar bought.
The practical read: a Fed that holds near 4% for years keeps the dollar's yield advantage intact against the currencies whose central banks are expected to cut or hold lower — the gap is the dollar's engine, and the projections promised to keep it running.
The pair-by-pair map
The decision's effects distribute unevenly across the board:
USD/JPY. The pair most sensitive to the Fed-BoJ gap. The hike widens the gap in the dollar's favour — the pair's structural bid — while the BoJ's own normalisation at 1.00% (preview) and the standing intervention risk (report) cap the move. The pair is the hike's tug-of-war, and the USD/JPY explainer maps the two forces.

EUR/USD. The dollar's move against the euro is proportional to the Fed-ECB gap, and the ECB's September hike to 2.50% (report) has kept the gap narrower than in the dollar's old cycles. The pair's reaction was the gap's arithmetic, not the dollar's alone. The EUR/USD explainer covers the relative logic.
GBP/USD. Sterling's story runs parallel: the BoE's split vote (preview) keeps the UK's own rate story live, and cable's reaction to the Fed was the net of the two banks' paths. The GBP/USD explainer maps the two-leg interaction.
The commodity pairs and gold. The hike's growth channel pressures the commodity currencies through softer global demand expectations, while gold's reaction runs through real yields — the gold and real yields explainer covers the metal's read of the same decision.
Emerging markets. The hike's sharpest victims are usually the high-yield EM currencies, whose carry shrinks relative to the dollar's — the EM explainer covers the funding squeeze the hike extends.
What changes for your plan
The decision changes the trading environment in four practical ways:
The dollar's floor is higher. The "higher for longer" projections put a structural bid under the dollar until the data forces the dots to move. Dollar weakness now needs a catalyst strong enough to shift the 2027 median — a high bar, and the plan should respect it.
The data's weight grows. With the Fed committed to its path, each US release is read for its power to move the dots. CPI and payrolls — the releases that rewrite the Fed's expectations — carry more weight than ever, and the calendar guide shows how to weight the week accordingly.
The gaps are the trades. The pair-level trades are the policy gaps: USD/JPY's wide gap with intervention as the counterweight, the narrower Fed-ECB and Fed-BoE gaps, and the EM carry's shrinking margin. The pair driver explainers map each gap.
The surprises still rule. The hike was priced; the path is not. Every future Fed communication — the speeches, the minutes, the next projections — carries the risk of rewriting the path, and the central bank language explainer supplies the vocabulary to read them.
The Fed's September decision was a confirmation wrapped in a signal: the hike confirmed what was priced, and the projections signalled a dollar-supportive path for years. Trade the gaps the projections created, weight the data that can move the dots, and respect the floor the "higher for longer" path has put under the dollar.
Sources
Common questions
What did the Fed do in September 2026?
It raised the federal funds target range by a quarter point to 3.75%–4.00% in a unanimous vote — the first increase since July 2023 — and published projections showing rates staying near 4% through 2027.
Why did the dollar react more to the projections than the hike?
Because the hike was fully priced in advance. The projections were the surprise — the 'higher for longer' path — and the dollar repriced on the path, not the decision.
Which pairs moved most on the Fed's decision?
USD/JPY, through the widened Fed-BoJ gap and the intervention counterweight; the European pairs, through their narrower gaps with the Fed; and the EM currencies, through the funding squeeze.
What does 'higher for longer' mean for the dollar?
A structural bid: the Fed's expected path near 4% through 2027 keeps the dollar's yield advantage intact. Dollar weakness now needs a catalyst strong enough to shift the projections.
Which data matters most after the Fed's decision?
The releases that can move the dots — US CPI and payrolls above all. Each print is now read for its power to shift the 2027 median, which raises their market weight.
This article is for information only and is not financial advice. Trading forex and CFDs carries a high risk of losing money. Read the risk warning. Spotted an error? Tell the editors.


Comments
Log in to join the discussion. Comments follow the community guidelines.
Log in to commentLoading comments…