New Zealand's slow growth: what it means for the RBNZ
New Zealand's economy grew just 0.2% in the June quarter — the slow growth behind the RBNZ's hike into the wind. Here is the composition and what it means for the kiwi's path.
New Zealand's economy grew 0.2% in the June quarter (report) — the slow growth that sits underneath the Reserve Bank of New Zealand's aggressive hike to 2.75% (report). The two numbers together are the kiwi's tension in public: a central bank tightening into the wind of a barely growing economy, because the inflation data demands it. The GDP report's composition tells the story's detail.
This analysis explains the GDP report and its meaning for the RBNZ's path. The policy context is in the RBNZ analysis; the transmission in how interest rate decisions move currencies.
The report's composition
The 0.2% headline is the growth story's surface; the composition is its depth. The report documents the mix: construction offsetting weaker transport and retail. The composition's message is the economy's two-sided state — one sector holding the line while the consumer-facing ones soften — and the RBNZ reads the balance when it weighs the growth side against the inflation side. The GDP guide covers reading the composition.
The growth picture's wider context is the same energy story running through the region: the fuel-driven inflation the RBNZ hiked against (report) is also the pressure on the consumer-facing sectors the GDP report shows softening. The energy shock analysis covers the two-sided shock the whole cycle shares.
The RBNZ's tension
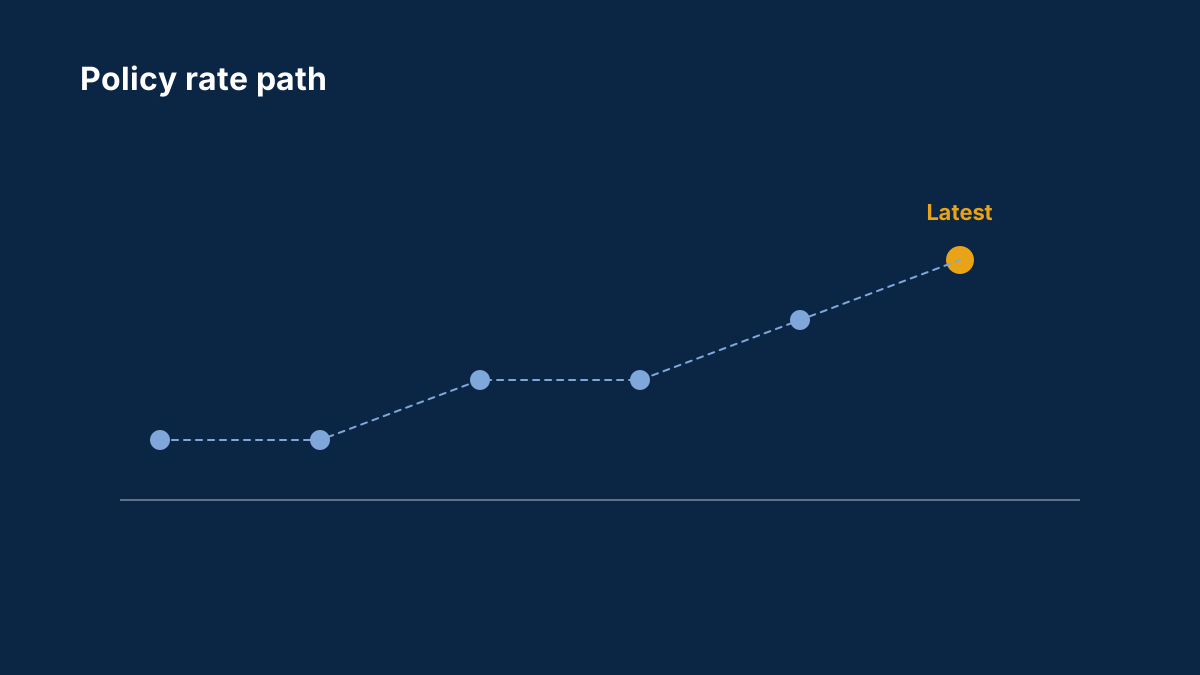
The GDP report sharpens the RBNZ's tension: the bank hiked into 0.2% growth because the inflation data demanded it, and the growth data now stands as the argument against the next hike. The tension's shape is the bank's reputation meeting the economy's reality — the aggressive style that hiked early now faces a growth picture that argues for patience, and the market prices both sides of the bank's next decision. The RBNZ analysis covers the tension's framework.
The tension's resolution runs through the same second-round question as everywhere else: if the energy-driven inflation fades before it spreads into wages, the growth side wins and the bank pauses; if the second round arrives, the inflation side wins and the tightening continues. The wage and services data is the arbiter — the inflation transmission explainer covers the second-round mechanics.
The kiwi's read
The GDP report's kiwi implications run through three channels:
The two-tailed rate story. The slow growth is the pause argument; the inflation is the hike argument — and the kiwi's rate story is live in both directions, with every release read for which side it strengthens. The RBNZ analysis has the two-tailed framework.
The growth-differential channel. Against the dollar, the growth story runs against the US consumer's resilience (report); against the aussie, it runs against Australia's 0.4% (report) — the regional growth differentials the pairs trade. The NZD/USD guide covers the sibling reads.
The risk-mood channel. With the rate story tense, the kiwi's high-beta character carries more of its daily movement — the thin, risk-sensitive currency follows the mood's turns. The risk sentiment guide has the read.
How to trade the growth story
The practical read:
- Read the composition, not just the headline — the sector mix is the economy's two-sided state, and the GDP guide has the reading.
- Track the tension's two sides — the inflation data against the growth data, with the wage releases as the arbiter. The RBNZ analysis supplies the framework.
- Watch AUD/NZD for the regional read — the cross trades the two economies' differential, and the NZD/USD guide covers the sibling's signal.
- Size for the two-tailed events — the kiwi's RBNZ and data days price both directions, and the thin pair's reactions are outsized. The position sizing guide has the method.
The regional comparison
The 0.2% growth reads sharper in its regional context. Australia grew 0.4% in the same quarter (report) — twice New Zealand's pace, and the differential is the aussie-kiwi cross's fuel: AUD/NZD trades the two economies' relative momentum, and the growth gap is the cross's current story. The NZD/USD guide covers the sibling read's mechanics.
The wider region adds the third reference: China's mixed August data — exports strong, domestic demand soft (report) — feeds both antipodean economies through the trade and commodity channels. The growth comparison that matters for the kiwi is therefore three-sided: New Zealand's 0.2% against Australia's 0.4% against China's mixed signal, and the pairs trade the relativities. The AUD/USD explainer maps the China channel both antipodean currencies share.

The second round, in the kiwi's terms
The RBNZ's tension resolves through the second-round question, and the kiwi's version has its own data watch. The releases that reveal whether the fuel-driven inflation is spreading into the economy's price-setting: wage growth — the labour market's pay data, which the RBNZ watches as the services inflation's driver — and the services components of the CPI itself. The inflation transmission explainer covers the second-round mechanics; the kiwi's version is the same chain, run on New Zealand's smaller, thinner data.
The second round's significance for the kiwi is the size of its consequences. If the wages and services data stay calm, the growth side of the tension wins — the RBNZ pauses, and the kiwi's rate story softens. If the second round arrives, the inflation side wins — the bank's aggressive style continues, and the currency's hawkish tail stays live. The thin market's reaction to either outcome will be outsized, because the kiwi's data moves a market with fewer eyes on it. The NZD/USD guide covers the pair's outsized-reaction character.
The three scenarios for the RBNZ
The growth-inflation tension resolves into three scenarios for the bank's next move, and the kiwi prices all three:
The pause. The second round fails to arrive, the growth data stays soft, and the bank holds at 2.75% — the majority scenario, and the one the 0.2% GDP report supports. The kiwi's rate story flattens, and the currency's direction falls back to the risk-mood and regional channels.
The continued hike. The second round arrives — wages and services prices absorbing the fuel costs — and the bank's aggressive style continues. The scenario is the hawkish tail the market prices on the kiwi's data days, and its arrival would lift the currency sharply.
The reversal. The tightening into the slowdown stalls the economy further, and the bank is forced to reverse — the aggressive style's mirror image. The scenario is the dovish tail, and the thin market's reaction to it would be violent.
The three scenarios' probabilities are the kiwi's rate story, and every release shifts them. The RBNZ analysis covers the framework; the market's pricing of the three is the pair's event-day range.
The technical and sizing read
The kiwi's technical read follows from its two-tailed story. The pair's levels around the RBNZ's decisions and the data releases are the scenarios' pricing zones — the ranges widen into the events as the market prices all three outcomes, and the range trading guide covers trading the event-anticipation ranges. The sizing follows the pair's character: the thin market's outsized reactions argue for smaller positions than the majors, with the risk-first arithmetic from position sizing applied to the kiwi's wider ranges.
The trade the market is actually pricing
Strip the release to its market meaning and the 0.2% print is a probability adjustment: it raised the odds of the pause and trimmed the odds of the continued hike, and the kiwi's price moved by exactly that adjustment. The market's arithmetic is the scenario framework in miniature — every data point shifts the three scenarios' weights, and the currency reprices the weighted sum. The releases that matter most are the ones that shift the weights most: the wage data, the services inflation components, and the RBNZ's own communication between meetings. The central bank language explainer covers reading the bank's signals between the data.
The adjustment's size is the kiwi's information edge in practice: because the market's attention is thinner than the majors', the same release shifts the weights further here — the repricing is larger, and the traders who read the release before the repricing completes are trading the market's own lag. The edge is real and small, and it belongs to the prepared: the economic calendar guide shows how to be waiting when the kiwi's data lands.
What the report does not say
The honest limits of the 0.2% print are worth stating. The number is quarterly, backward-looking, and revised — the June quarter's story is already months old by the time it lands, and the market's reaction is to the revisions and the composition as much as the headline. The print says nothing about the September quarter, nothing about the second round's progress, and nothing about the RBNZ's internal balance — all of which the market must read from the timelier releases that follow. The GDP guide covers the release's lags and revisions.
The limits matter because they define the trade's shelf life. The GDP-driven move fades as the timelier data arrives — the wage prints, the services inflation, the bank's speeches — and the trader who holds the GDP trade past the next release is trading yesterday's information. The practical rule: the GDP print is a position adjustment, not a position — its move is priced, its edge is consumed, and the next release takes over.
The kiwi's place in the wider book
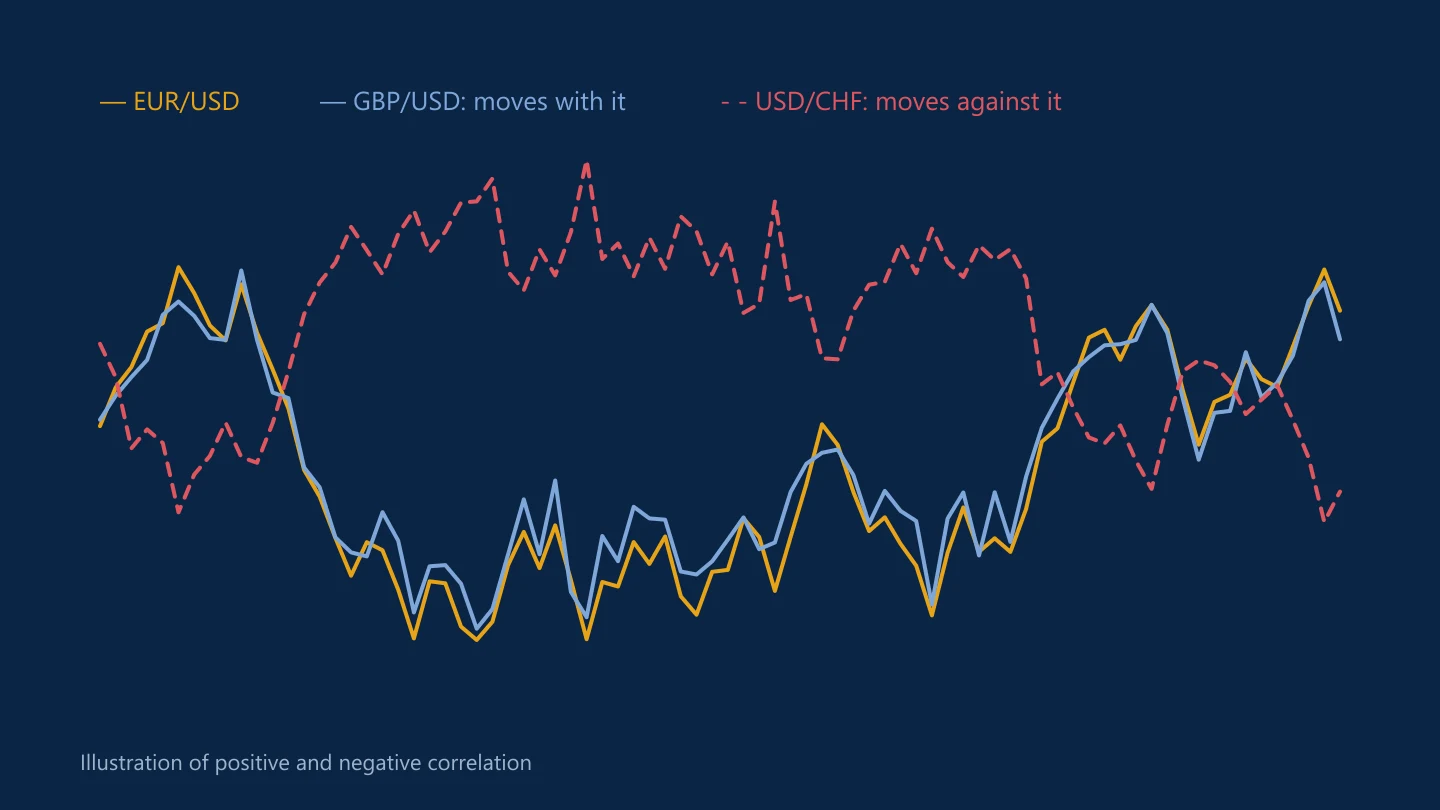
The final read is the kiwi's place in a currency book. The pair's two-tailed rate story, its thin market and its regional dependencies make it a satellite instrument: it amplifies the antipodean and risk stories rather than leading them. In the book's terms, the kiwi position belongs to the risk group — the correlation guide covers grouping the exposure — and its size belongs below the majors', because the same move costs more here. The NZD/USD guide covers the pair's role in the wider complex, and the honest summary is the one the whole analysis has been building toward: the kiwi is the region's clearest expression of the growth-inflation tension, and the trader who reads the tension trades the clearest expression.
New Zealand's 0.2% growth is the RBNZ's tension in a number — the slow economy underneath the aggressive hike. Read the composition, the tension's two sides and the regional differentials, and the kiwi's story becomes the RBNZ's next decision, priced in advance.
Sources
Common questions
How much did New Zealand's economy grow?
0.2% in the June quarter, with construction offsetting weaker transport and retail — the slow growth underneath the RBNZ's aggressive hike to 2.75%.
Why is the RBNZ hiking into slow growth?
Because the inflation data demands it — the fuel-driven pressures the bank answered with its September hike. The growth data now stands as the argument against the next hike.
What decides the RBNZ's next move?
The second-round question: if the energy inflation fades before spreading into wages, the growth side wins and the bank pauses; if the second round arrives, the tightening continues.
How does the growth data affect the kiwi?
Through the two-tailed rate story — the pause argument against the hike argument — plus the growth differentials against Australia and the US, and the kiwi's risk-mood sensitivity.
Which data matters most for the kiwi now?
The wage and services data — the second round's arbiter — plus the RBNZ's language and the AUD/NZD cross for the regional differential.
This article is for information only and is not financial advice. Trading forex and CFDs carries a high risk of losing money. Read the risk warning. Spotted an error? Tell the editors.


Comments
Log in to join the discussion. Comments follow the community guidelines.
Log in to commentLoading comments…