What's the state of the carry trade?
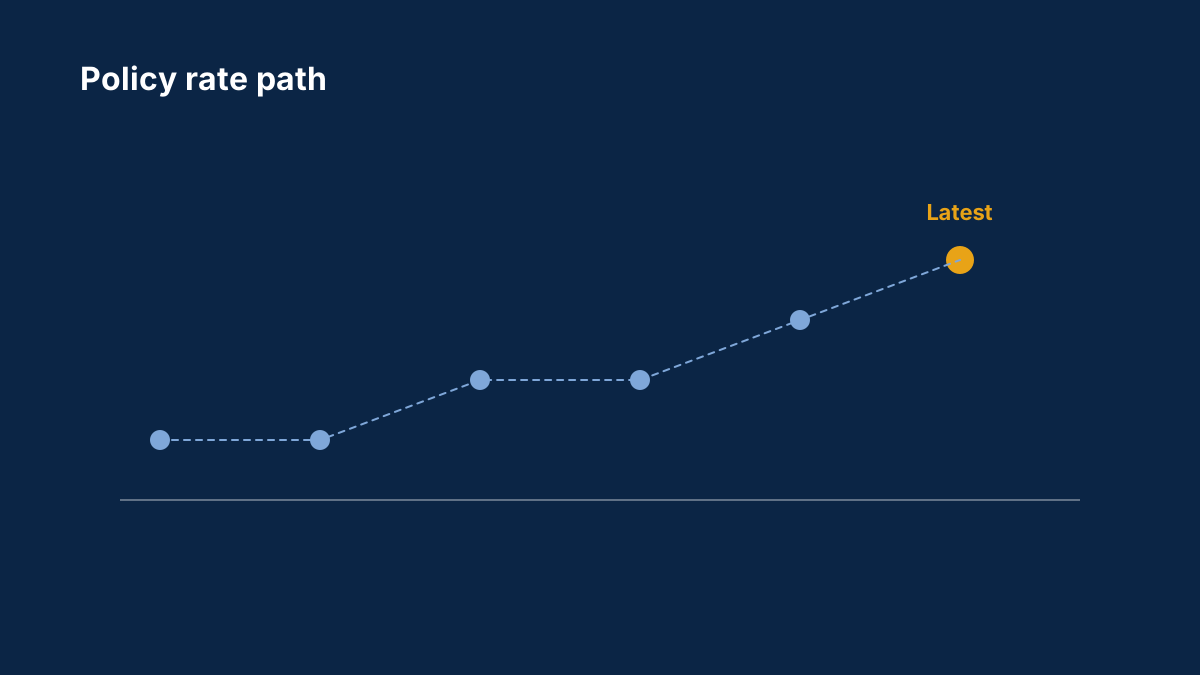
With the Fed at 3.75%–4.00% and the BoJ at 1.25% (Fed report, BoJ report), the carry map has reshaped. The question is which carries compensate for their risk.
What's your read?
- the carry pairs you find attractive or dangerous
- how intervention risk prices into yen carries
- the unwind scenario you're watching for
Background: carry trade explained.
Background: Why carry trades unwind so violently
Carry trades earn steady yield for months and then collapse in days — and the collapse is structural, not accidental. Here is the mechanics of the unwind and why it hits every market at once.
What is a carry trade unwind?
The forced reversal of carry positions: traders sell the investment currency and buy back the funding currency, usually under margin pressure. The buying pushes the funding currency up and feeds further exits.
Why do carry trades collapse so fast?
Because the trade is crowded, and the exits feed themselves: each round of forced buying strengthens the funding currency, deepening losses and triggering the next round. The loop is self-reinforcing.
Comments
Log in to join the discussion. Comments follow the community guidelines.
Log in to commentLoading comments…