ATR-based stops: what multiple do you use, and on which time frame?
Using average true range to set stop distance is common, but the details vary a lot. Some traders use 1× daily ATR, some 2× on the 4-hour chart, others a swing level plus half an ATR.
Share what you use and how you got there:
- the ATR period and time frame
- the multiple, and whether you trail the stop
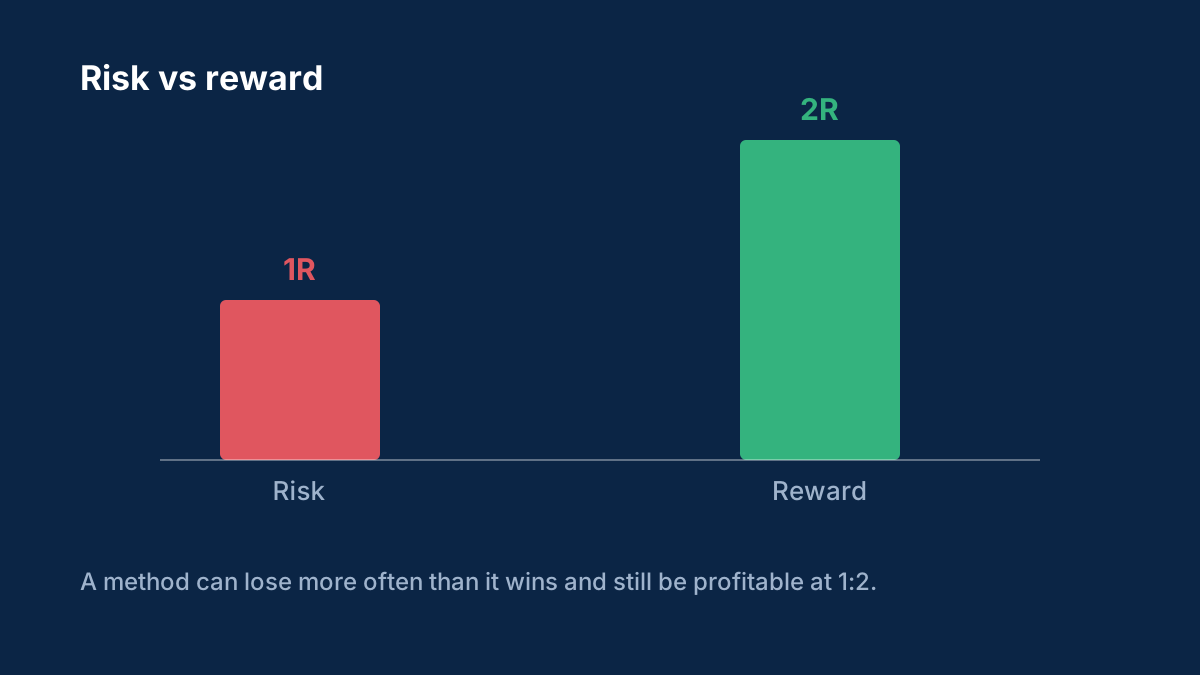
- how changing the multiple affected your win rate and average loss when you tested it
It's especially useful to hear from anyone who tested several multiples on the same set of trades. The ATR guide has a worked example of turning an ATR stop into a position size.
Comments
Log in to join the discussion. Comments follow the community guidelines.
Log in to commentLoading comments…
A worked example of turning an ATR stop into a position size, for anyone new to the method.
EUR/USD on the 4-hour chart, 14-period ATR of 18 pips, using a 2× multiple:
- Stop distance: 2 × 18 = 36 pips from entry.
- Risk: a $5,000 account risking 1% has $50 at risk.
- Size: $50 ÷ (36 × $10 per standard lot pip) = 0.139, rounded down to 0.13 lots.
The point of the method is that size adjusts automatically: when volatility doubles, the stop widens and the position shrinks, so the money at risk stays the same.
Two things worth testing if you compare multiples: a smaller multiple usually raises the share of trades stopped out by normal noise, and a larger one lowers the win rate needed but makes each loss take longer to recover in pips. Comparing them on the same set of entries is the only fair test. Full guide: ATR and volatility stops.
0