Risk-reward ratio, win rate and expectancy: the maths behind a trading edge
A high win rate can still lose money. See how win rate and risk-reward combine into expectancy, with break-even win rates and worked examples.
Two numbers decide whether a trading method makes money over time: how often it wins, and how much it wins compared with how much it loses. Either number on its own is misleading.
Measuring trades in R
Expressing results as multiples of the amount risked makes trades comparable. Risk $50 and lose it, and the result is −1R. Make $100 on the same risk, and it's +2R. A method's win rate, average win and average loss in R describe it better than its dollar profits, because they don't change when position size does.
Expectancy
Expectancy is the average result per trade:
Expectancy = (win rate × average win) − (loss rate × average loss)
Two examples in R:
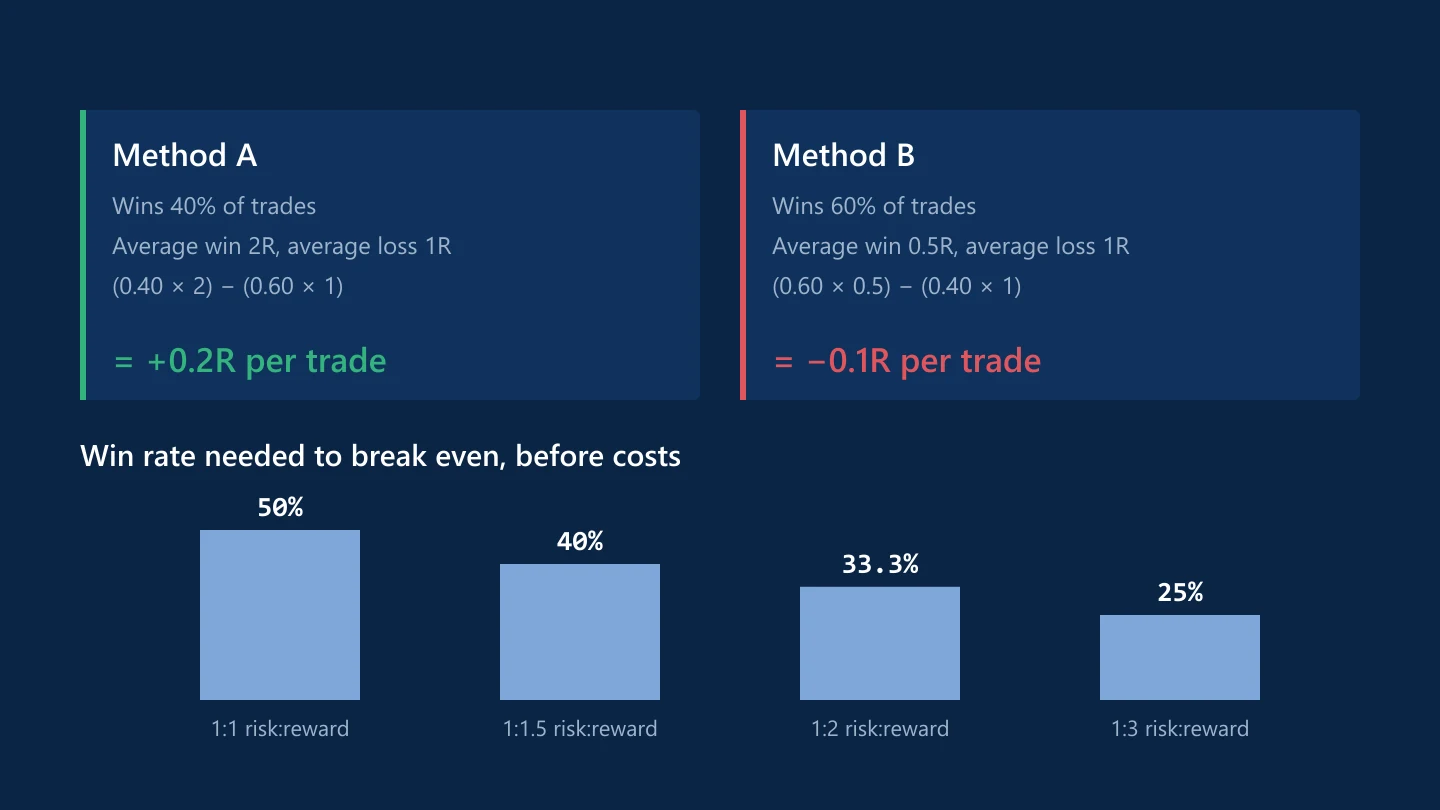
- 40% winners averaging 2R, losers averaging 1R: (0.40 × 2) − (0.60 × 1) = +0.2R per trade. Over 100 trades risking $50 each, that's about +$1,000 before costs.
- 60% winners averaging 0.5R, losers averaging 1R: (0.60 × 0.5) − (0.40 × 1) = −0.1R per trade. It wins more often and still loses money.
Break-even win rates
With a fixed reward-to-risk ratio, the win rate needed to break even before costs is 1 ÷ (1 + reward-to-risk):
- 1:1 needs 50% winners
- 1:1.5 needs 40%
- 1:2 needs about 33.3%
- 1:3 needs 25%
A bigger target lowers the win rate you need, but distant targets are reached less often. Ratio and win rate pull against each other, which is why expectancy is the number to track.
Costs change the maths
Spread, commission and swap come out of every trade. On a trade risking 10 pips, a 1-pip spread costs 0.1R, so a method with +0.1R expectancy before costs is roughly break-even after them. The shorter your stops and targets, the more costs matter, which is a big reason scalping is hard.
Getting honest numbers
- Use a large sample. Twenty trades can make a losing method look good by chance. Aim for at least 100 before drawing conclusions.
- Record every trade, including the ones you'd rather forget, in a trading journal.
- Record results in R so changes in position size don't distort the picture.
- Expect losing streaks even with positive expectancy. A method that wins 40% of the time will regularly lose five or more trades in a row; see drawdown and recovery.
Common questions
What is a good risk-reward ratio in forex?
There isn't one right ratio. What matters is expectancy, the win rate and ratio together. A 1:2 ratio breaks even at about 33% winners before costs, while a 1:1 ratio needs 50%.
How do you calculate trading expectancy?
Multiply the win rate by the average win and subtract the loss rate multiplied by the average loss. Measuring wins and losses in multiples of the amount risked (R) makes the result easy to compare.
Can a strategy with a high win rate lose money?
Yes. A method that wins 60% of the time but makes only half as much on winners as it loses on losers has an expectancy of −0.1R per trade.
This article is for information only and is not financial advice. Trading forex and CFDs carries a high risk of losing money. Read the risk warning. Spotted an error? Tell the editors.
Comments
Log in to join the discussion. Comments follow the community guidelines.
Log in to commentLoading comments…