The US 10-year Treasury yield closes at 5.29%, its highest since May 2002
Treasury's own par yield curve data show the 10-year yield rose 53 basis points between 31 August and 2 October. The 2-year closed at 4.92% on 28 September, the highest since May 2024, and the 30-year at 5.64%.
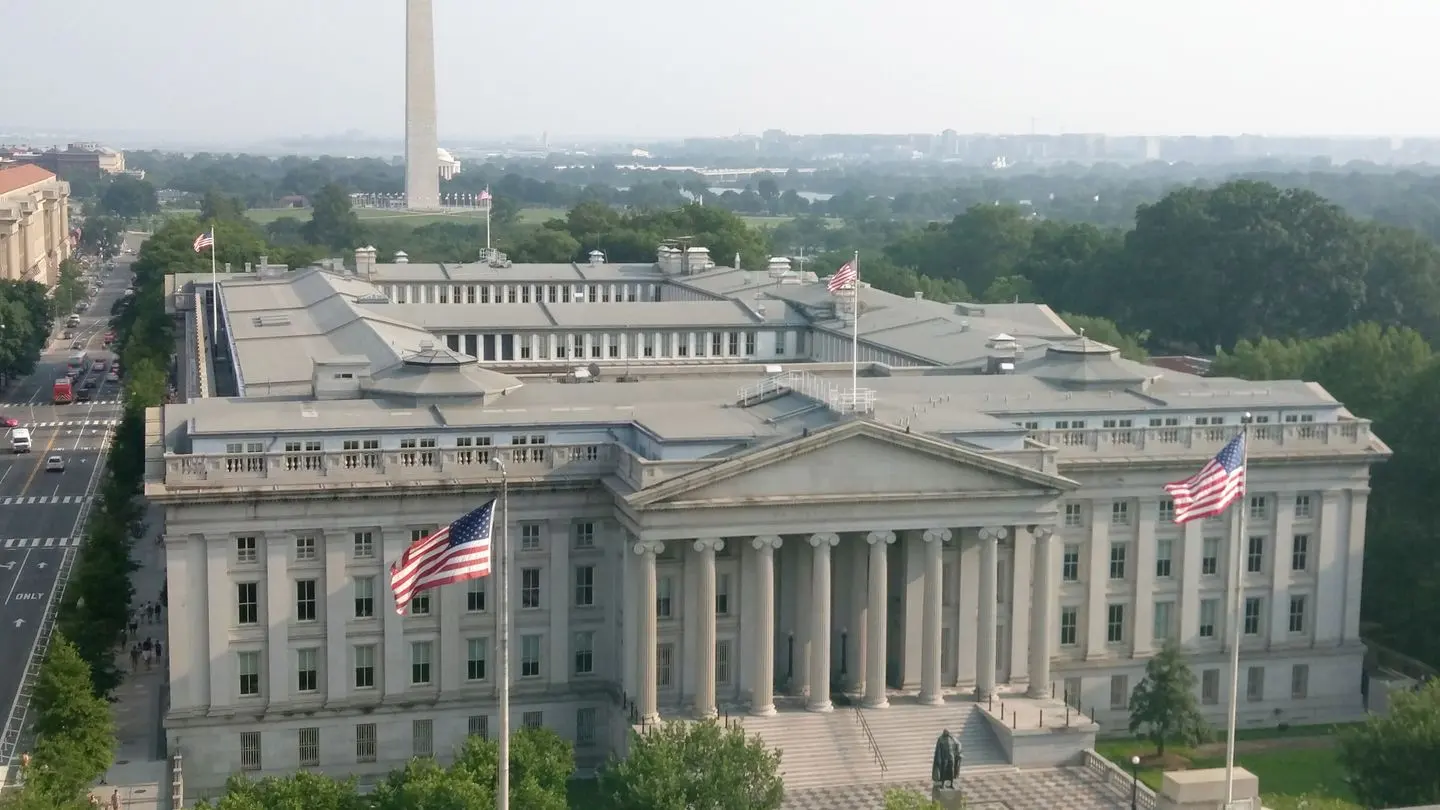
The yield on the 10-year US Treasury note closed at 5.29% on 30 September 2026, its highest close since 14 May 2002, according to the daily par yield curve rates the US Treasury publishes. On 2 October it closed at 5.28%. The figures below come from Treasury's data, not from trading venues, and cover closing levels only.
How far yields have moved
- 10-year: 4.75% on 31 August, 5.28% on 2 October, up 53 basis points. The 2026 low close was 3.97% at the end of February
- 2-year: 4.34% to 4.83%, up 49 basis points. It closed at 4.92% on 28 September, the highest since 30 May 2024
- 30-year: 5.25% to 5.63%. Its highest close in this run was 5.64% on 30 September
- Month-end 10-year yields in 2026: 4.26% in January, 4.30% in March, 4.44% in June, 4.75% in July and August, 5.29% in September
The previous peaks in Treasury's series are lower: the highest 10-year close in 2007 was 5.26% on 12 June, and in 2023 it was 4.98% on 19 October. The last close above 5.29% before this September was 5.32% on 14 May 2002.

The path in September
The 10-year closed at 5.01% on the day of the Fed's decision, 16 September, and at 4.94% the day after. The big moves came after: 4.96% on 22 September, 5.11% on 23 September, the day of the flash PMIs when the US composite hit a five-year high (report), then 5.18% on 24 September, 5.17% on 25 September, 5.24% on 28 September and 5.29% on 30 September. The 10-year closed at 5.24% on 1 October and 5.28% on 2 October, the day payrolls rose only 29,000 (report).
Why yields are rising
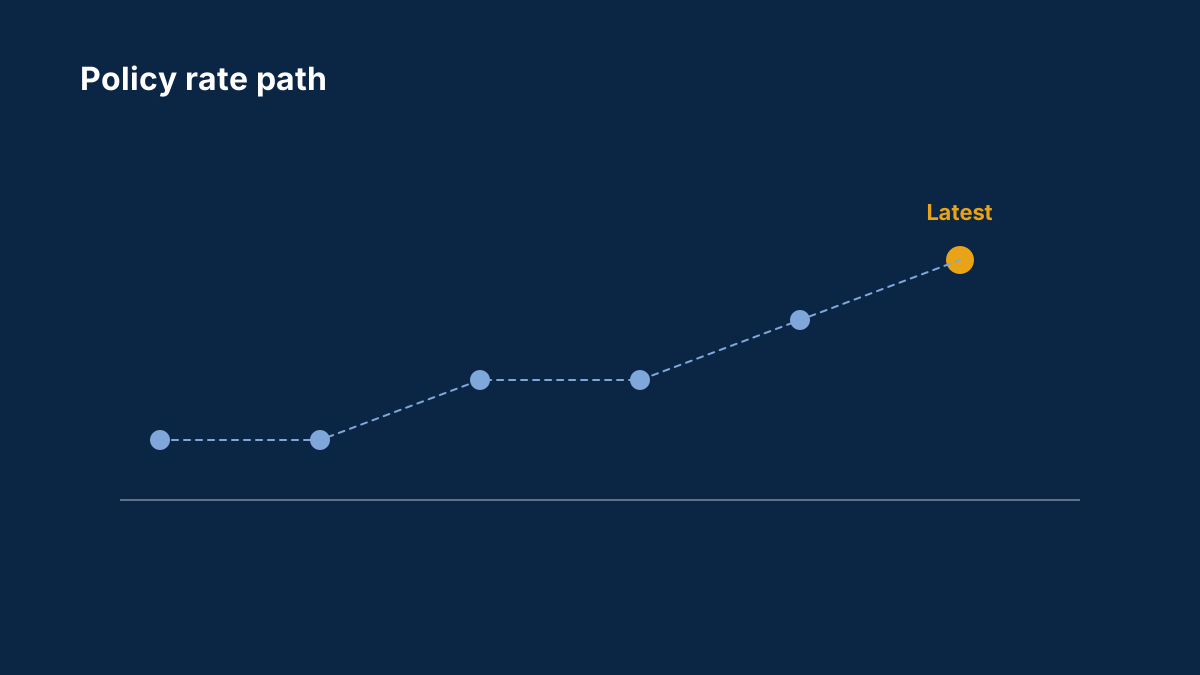
The Bank for International Settlements said earlier in September that yields were rising on a tighter expected policy path and a higher term premium, the compensation investors require for holding longer bonds (report). Since then the data have kept inflation in view: PCE inflation was 3.4% in August (report) and the ISM manufacturing prices index jumped to 77.9 (report). The Fed's target range is 3.75%–4.00%, and a 2-year yield at 4.83% sits well above it, which is generally read as a market expecting higher policy rates.
What it means for currencies
Currency traders watch Treasury yields because the gap between US yields and those elsewhere moves exchange rates (bond yields and exchange rates). Higher US yields tend to support the dollar and weigh on gold, which pays no interest (US Dollar Index explained). Live prices: XAU/USD and USD/JPY.
What happens next
September's consumer prices are due on 14 October and the Fed decides on 28 October.
Sources
Common questions
What is the 10-year Treasury yield now?
It closed at 5.28% on 2 October 2026, after closing at 5.29% on 30 September, according to the US Treasury's daily par yield curve rates.
Is the 10-year Treasury yield at a record?
No, but the 5.29% close on 30 September 2026 was the highest since 14 May 2002 in Treasury's data, above the 2007 peak of 5.26% and the 2023 peak of 4.98%.
How much have Treasury yields risen since August 2026?
The 10-year yield rose from 4.75% on 31 August to 5.28% on 2 October, and the 2-year from 4.34% to 4.83%.
Why are Treasury yields rising?
The BIS pointed to a tighter expected policy path and a higher term premium. Recent data on inflation and activity, including PCE inflation of 3.4% and strong PMI surveys, have kept those pressures in view.
What are par yield curve rates?
Yields the Treasury interpolates from closing bid prices of recently auctioned securities, quoted for fixed maturities such as 2, 10 and 30 years.
This article is for information only and is not financial advice. Trading forex and CFDs carries a high risk of losing money. Read the risk warning. Spotted an error? Tell the editors.


Comments
Log in to join the discussion. Comments follow the community guidelines.
Log in to commentLoading comments…