Price action only: what does your chart look like?
No indicators, no oscillators — just candles, structure and levels. Price-action traders argue everything else is derivative, and plenty of them are right about their own methods.

Describe your naked chart:
- the levels you mark and how
- the candle behaviour you wait for at those levels
- what you gave up when you removed the indicators
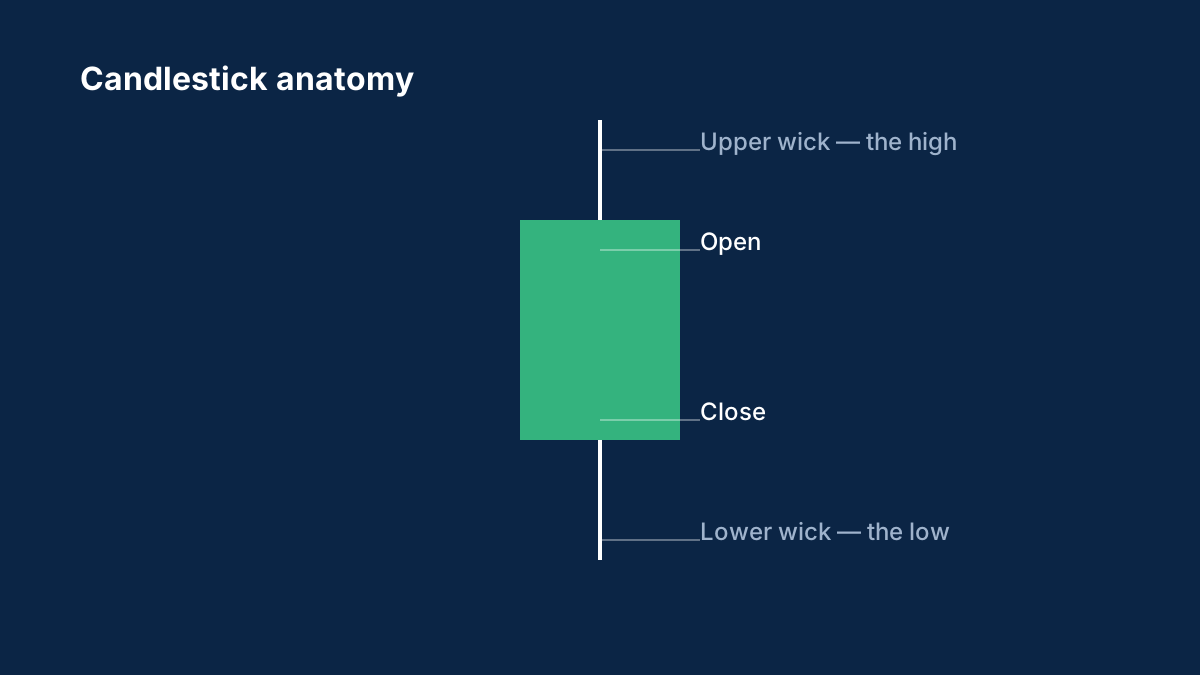
The candlestick guide and support and resistance are the whole toolkit here.
Background: Support and resistance: how traders mark price levels
Support and resistance are the most widely used ideas in chart reading. How to find levels, why they work as zones, and what happens when they break.
What is support and resistance in forex?
Support is a price area where falling prices have tended to stop, and resistance is an area where rising prices have tended to stall, often because many orders cluster there.
What happens when support breaks?
The price often falls further, and the old support level frequently acts as resistance if the price comes back up to it.
Comments
Log in to join the discussion. Comments follow the community guidelines.
Log in to commentLoading comments…