MACD crossovers: do they hold up in your testing?
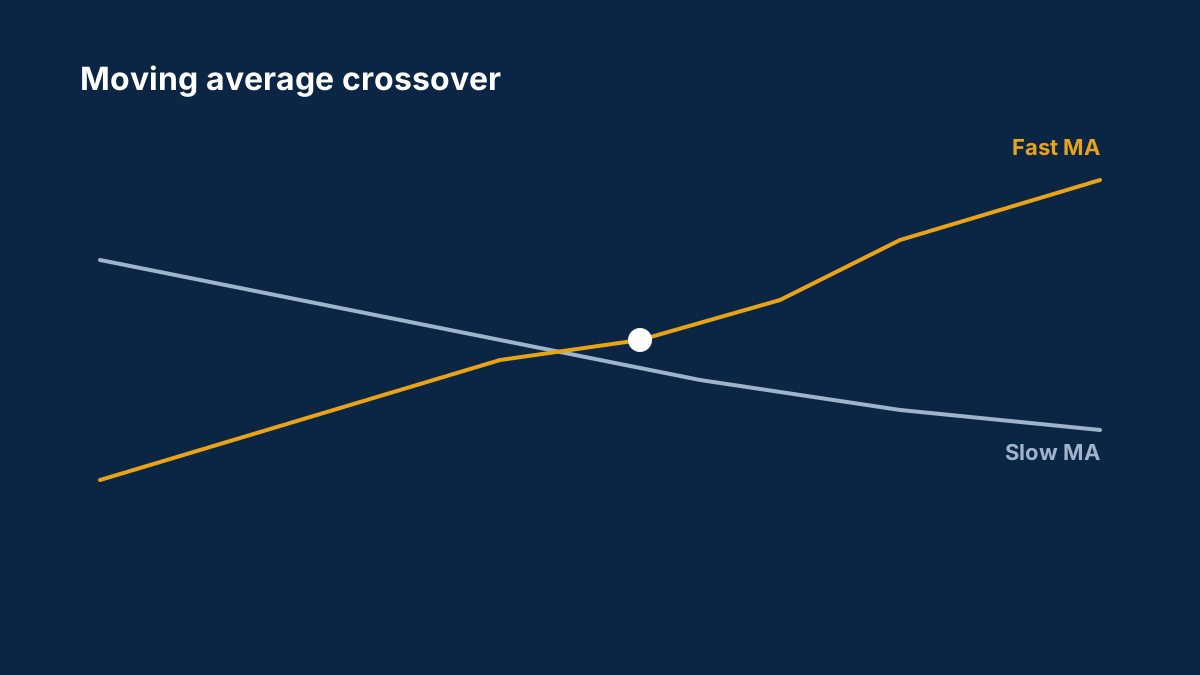
The MACD crossover is the first signal many traders test, and the first one they learn to distrust: in ranges it whipsaws, in trends it's late. The survivors use it as a filter rather than a trigger.

How do you use MACD now?
- the role it plays in your method
- the settings you changed and why
- whether you've tested it as a standalone signal
The MACD guide explains what the indicator actually measures.
Background: The MACD indicator explained: signal line, histogram and divergence
MACD measures the gap between two exponential moving averages. Here is how the line, signal line and histogram are calculated, and the ways traders read them.
What do the MACD settings 12, 26 and 9 mean?
The MACD line is the 12-period exponential moving average minus the 26-period one, and the signal line is a 9-period exponential moving average of the MACD line.
What is a MACD crossover?
When the MACD line crosses its signal line. Crossing above is read as bullish momentum and below as bearish, but crossovers give many false signals in sideways markets.
Comments
Log in to join the discussion. Comments follow the community guidelines.
Log in to commentLoading comments…