Heikin-Ashi and Renko charts: what they show and hide
Heikin-Ashi and Renko charts change how price is drawn. Here is how each one is built, what each one smooths out and why neither replaces a normal candlestick chart.
Heikin-Ashi and Renko are two ways of drawing price that differ from the standard candlestick. Both filter noise in different ways, and both remove information that a normal candle shows. Knowing what is removed matters more than knowing how the chart looks.
Heikin-Ashi
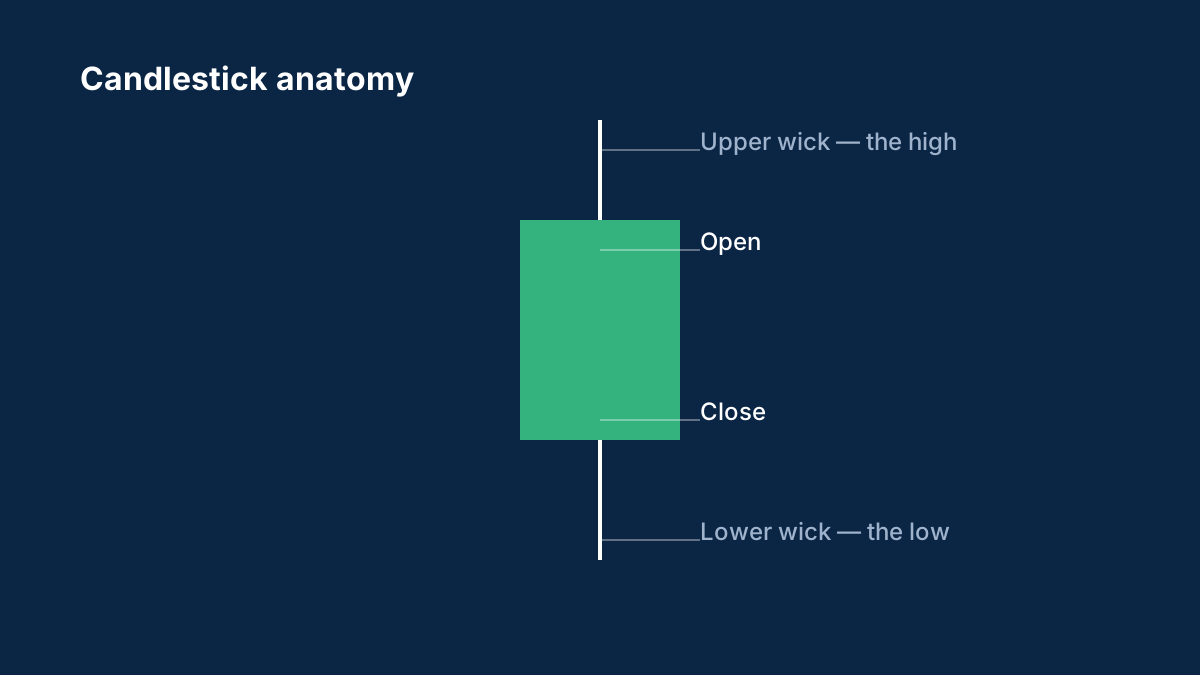
A Heikin-Ashi candle is calculated from the previous candle as well as the current one:
- Close = (open + high + low + close) ÷ 4
- Open = the average of the previous Heikin-Ashi candle's open and close
- High = the highest of the high, the Heikin-Ashi open and the Heikin-Ashi close
- Low = the lowest of the low, the Heikin-Ashi open and the Heikin-Ashi close
Because each open is averaged from the previous candle, the series is smoothed. Strong trends often appear as runs of same-coloured candles with small wicks. The cost is that a Heikin-Ashi open is not a price that traded. The chart cannot show where price actually was, so a breakout level drawn on it can sit away from the real trades.
Renko
A Renko chart ignores time. It draws a new brick only when price moves a set amount, the box size, in one direction. A brick continues in the same direction when price moves one more box, and a reversal is usually drawn only after price moves two boxes the other way.
The chart hides how long a move took, the wicks, and the path price followed inside each brick. Quiet periods disappear entirely. The box size also decides the shape of the chart: a small box shows many bricks and a large box shows few, so the same market can look different at different settings.
How to use them
Both charts can help show the direction of a trend, but they work best beside a normal candlestick chart rather than in place of one. Use the standard chart for entries, stops and levels, and check any level found on a transformed chart against the standard chart before acting on it. For how candles are read, see how to read candlestick charts.
Common questions
How is a Heikin-Ashi candle calculated?
Its close is the average of the open, high, low and close. Its open is the average of the previous Heikin-Ashi open and close. Its high and low are the most extreme of the actual high or low and the Heikin-Ashi open and close.
What does a Renko chart ignore?
Time. A new brick forms only when price moves by the set box size, so quiet periods and the path inside each brick do not appear.
Was this guide helpful? 0 found it helpful, 0 did not.
Sign in with a confirmed email to answer.
This article is for information only and is not financial advice. Trading forex and CFDs carries a high risk of losing money. Read the risk warning. Spotted an error? Tell the editors.
Comments
Log in to join the discussion. Comments follow the community guidelines.
Log in to commentLoading comments…