Do you redraw support and resistance levels every day, or keep them fixed?
Support and resistance are price levels where the market has reacted before, and many members use them to plan entries and stops. They are a judgement rather than a measurement, so two traders can mark the same chart differently. How to trade with RSI covers a momentum tool that members often combine with price levels to check whether a level is holding or breaking.
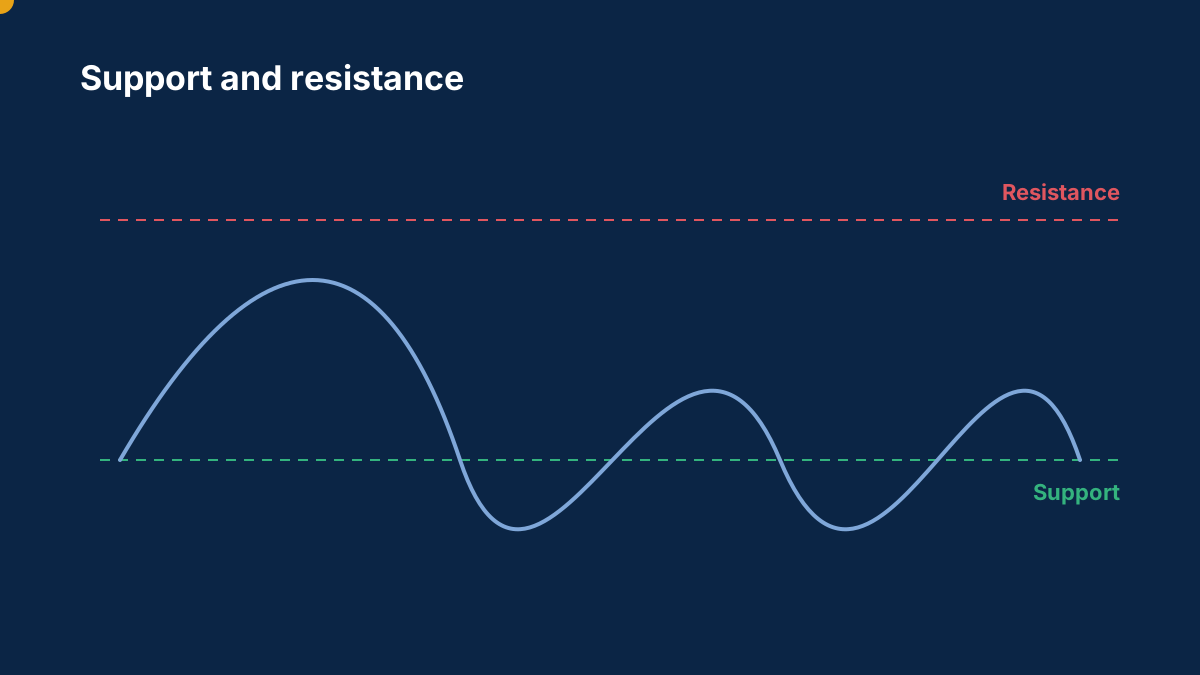
Members disagree on how often to update them. Some keep the same levels for weeks, while others redraw them after each session as new prices form. The question is how to keep levels useful without making them move every time the chart does, and how to decide which timeframe a level belongs to. A level marked on a daily chart can matter more than three marked on a five-minute chart, but only if you know which one you are trading.
We would like to hear your routine:
- How often do you review your support and resistance levels?
- Do you mark them on a higher timeframe, or on the one you trade?
- What makes a level strong enough to keep, in your view?
- Have you traded a level that stopped working? What did you do afterwards?
Please share your own approach and reasoning, not calls for others to copy. Posts that promise a direction or sell signals will be removed.
Background: How to trade with RSI: overbought, oversold and divergence
RSI is the most popular oscillator in trading and the most misread. Here is what it actually measures, where its signals work, where they fail, and how professionals use it as a filter rather than a trigger.
What does RSI overbought actually mean?
That the recent move has been one-sided — up closes dominating the last 14 periods — not that the market is expensive. In a range, overbought suggests exhaustion; in a trend, it is normal and can persist.
Does RSI divergence work?
Divergence is real but overrated alone: it can print repeatedly through an entire trend. It becomes tradeable only with context — a level, a reversal structure and a mature trend.
Comments
Log in to join the discussion. Comments follow the community guidelines.
Log in to commentLoading comments…