How do you set up your charts as a beginner?
A clean chart is a skill in itself. New traders often start with five indicators, four time frames and rainbow colours, then spend months removing most of it.
What does your chart look like now?
- which time frames you keep open
- the indicators you actually use, if any
- the pair list you watch
A useful exercise: describe your chart in words, and ask an experienced member to describe theirs. Compare the clutter. The moving averages guide is a good first stop if you're adding an indicator.
Background: Moving averages explained: SMA and EMA
Moving averages smooth out price noise to show the trend. How simple and exponential averages are calculated, which periods traders use and where they fail.
What is the difference between SMA and EMA?
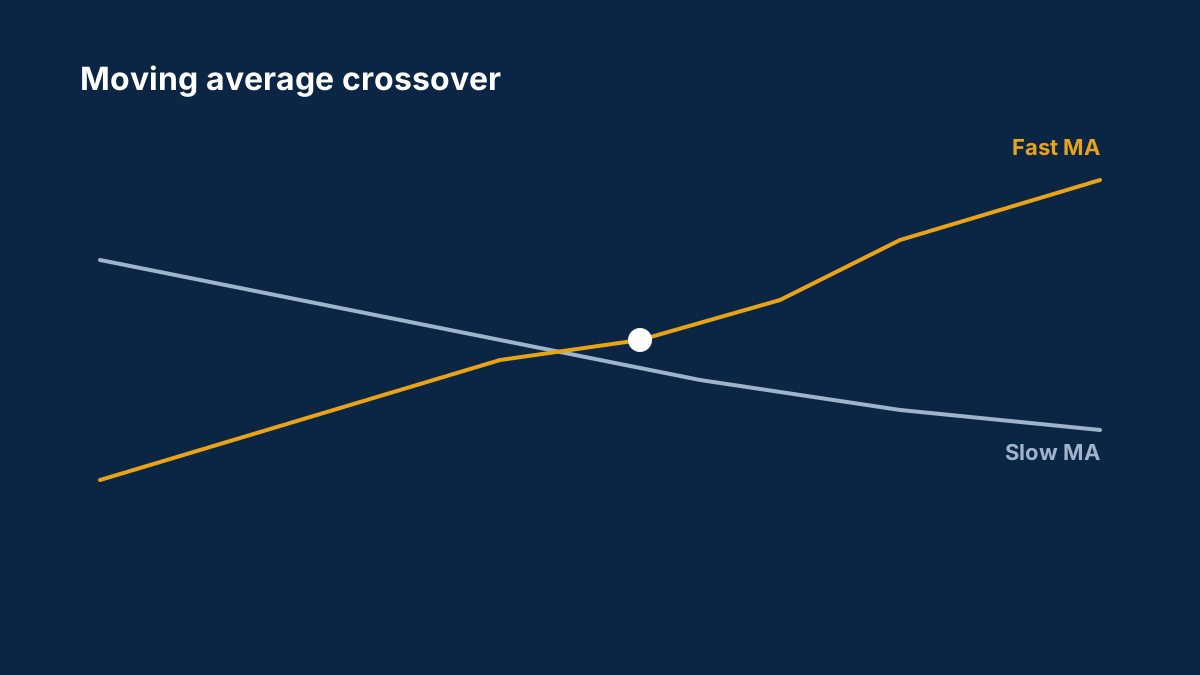
An SMA weights every period equally. An EMA gives more weight to recent prices, so it responds faster to new moves but can give more false signals.
What is a golden cross?
When a shorter moving average, typically the 50-period, crosses above a longer one, typically the 200-period. Many traders read it as a sign of a strengthening uptrend.
Comments
Log in to join the discussion. Comments follow the community guidelines.
Log in to commentLoading comments…