Fifteen-minute entries: what's your exact trigger?
The 15-minute chart is the day trader's execution field, and the trigger needs precision: a candle close beyond a level, a rejection wick, an engulfing pattern. Vague triggers produce vague results.
Define yours:
- the trigger candle or pattern
- the stop and target structure around it
- the time of day you'll take it

The candlestick guide supplies the trigger vocabulary.
Background: How to read candlestick charts
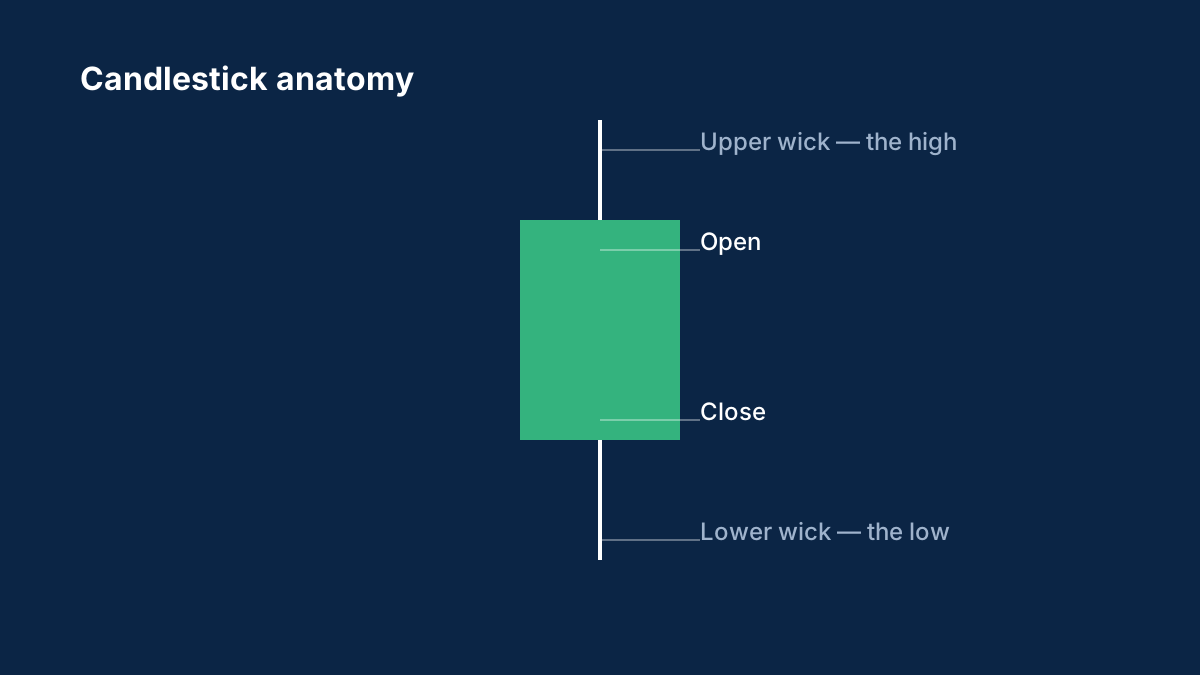
Candlesticks pack four prices into one shape. How to read the body and wicks, what timeframes mean and why single patterns are weaker than they look.
What do the wicks on a candlestick mean?
The wicks show the highest and lowest prices reached during the period. A long wick shows that the price moved there but was pushed back before the candle closed.
Are candlestick patterns reliable?
Not on their own. They are more meaningful at important price levels and on higher timeframes, and they should be combined with a clear plan for risk.
Comments
Log in to join the discussion. Comments follow the community guidelines.
Log in to commentLoading comments…