Doji and engulfing patterns: do you actually trade them?
The doji signals indecision; the engulfing pattern signals a reversal attempt. Both are famous, both are everywhere on charts, and both fail constantly without context. Beginners learn the shapes before they learn the conditions.
Do you trade candle patterns?

- which one, and what context you require
- how often it fails for you
- what you'd tell a beginner about patterns
The candlestick guide puts the patterns in proper context.
Background: How to read candlestick charts
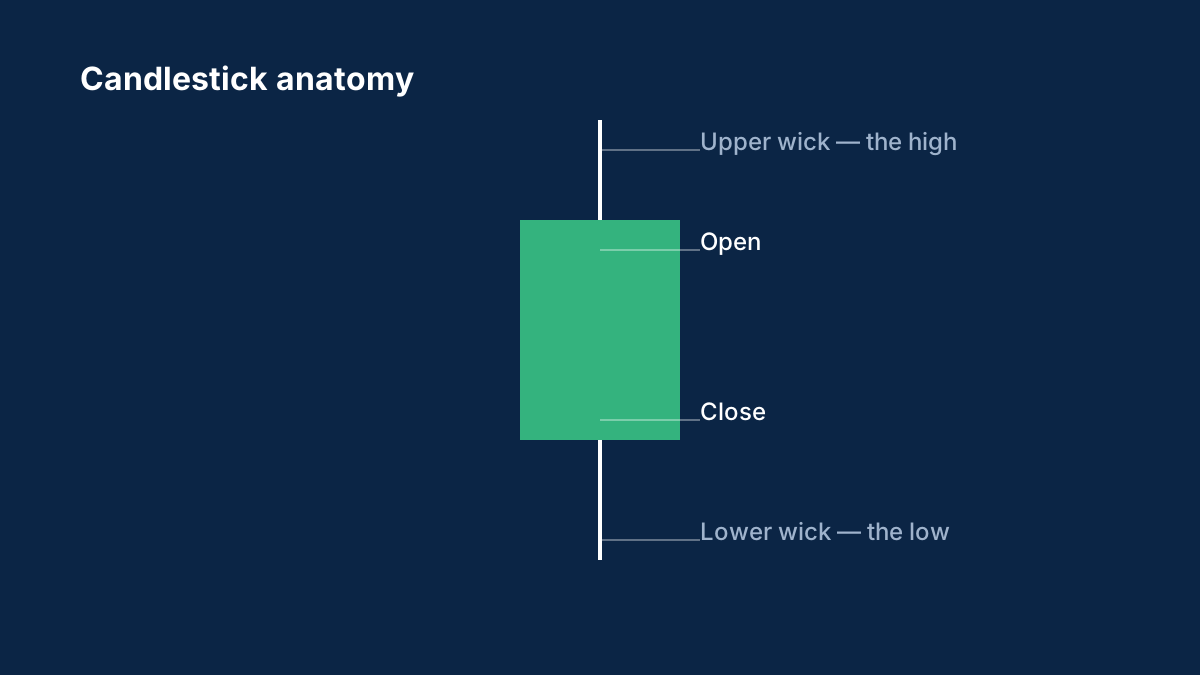
Candlesticks pack four prices into one shape. How to read the body and wicks, what timeframes mean and why single patterns are weaker than they look.
What do the wicks on a candlestick mean?
The wicks show the highest and lowest prices reached during the period. A long wick shows that the price moved there but was pushed back before the candle closed.
Are candlestick patterns reliable?
Not on their own. They are more meaningful at important price levels and on higher timeframes, and they should be combined with a clear plan for risk.
Comments
Log in to join the discussion. Comments follow the community guidelines.
Log in to commentLoading comments…