Where do you find your broker's execution statistics, and have you ever compared them with your own fills?
Some brokers publish execution statistics: average fill speed, the share of orders filled at the requested price, the share filled at a better or worse price, and rejection or requote rates. Others publish nothing, or publish a summary without the underlying method. When markets move quickly, as the euro did this week, falling 3.6% against the dollar on ECB reference rates in a month (report), these figures matter more.
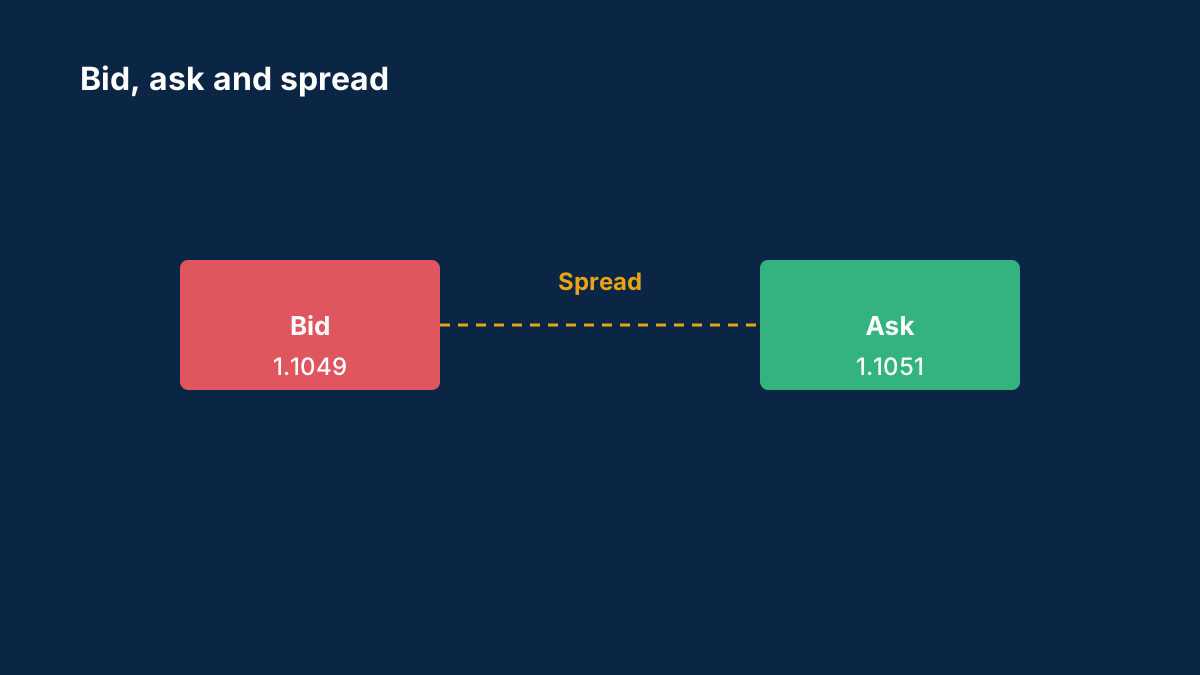
Published statistics can differ from what any one trader sees. They are averages over many accounts and instruments, and they may cover a different period than the one you care about. Your own order history is the other data source: the time of each order, the requested price, the fill price and the market price at the time.
Spread, commission and swap and bid, ask and slippage explained cover what the numbers mean.
We would like to hear what you have found:
- Where does your broker publish execution statistics, if it does, and how detailed are they?
- Have you compared them with your own fills? What method did you use?
- Did the two agree, and where did they differ?
- If your broker publishes none, what do you use to judge execution?
Please describe what you observed rather than posting verdicts on a broker, and leave out account numbers and other personal details. Posts that promise returns or sell signals will be removed.
Background: Bid, ask and slippage: why your order fills at a different price
Why buy trades open at one price and close at another, why a stop can trigger when the chart never touched it, and how slippage happens.
Why did my stop-loss trigger when the price on the chart didn't reach it?
Charts usually show the bid price, but a sell position's stop is triggered by the ask. If the spread widened, the ask could have touched your stop while the bid line stayed away from it.
What is slippage?
The difference between the price you expected and the price your order was filled at. It is most common in fast or thin markets, such as around news releases.
Comments
Log in to join the discussion. Comments follow the community guidelines.
Log in to commentLoading comments…