Do you compare your broker's EUR/USD quote with the ECB reference rate? Show us how you check for differences
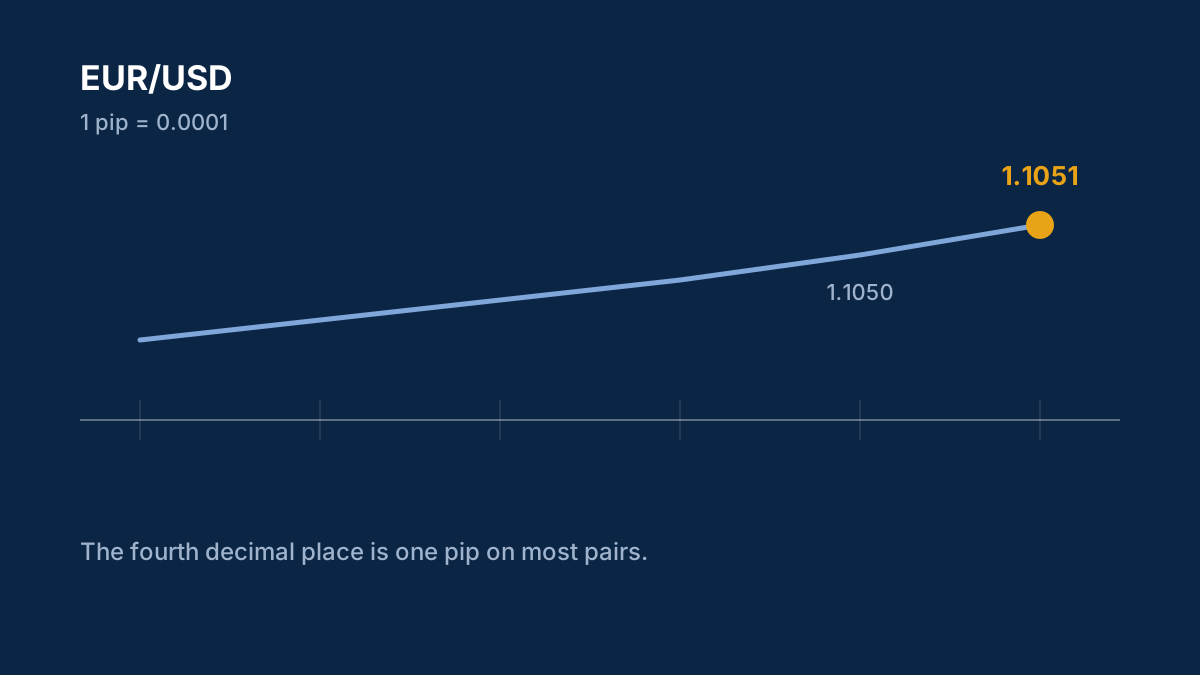
The European Central Bank publishes a euro reference rate against the US dollar every working day at 2:15 p.m. Central European Time, which is 12:15 UTC until clocks change on 25 October. On 5 October it was $1.1204 (report). It is a single daily fixing, so it will not match your broker's quote at that moment exactly, but it gives a free, official point of comparison.
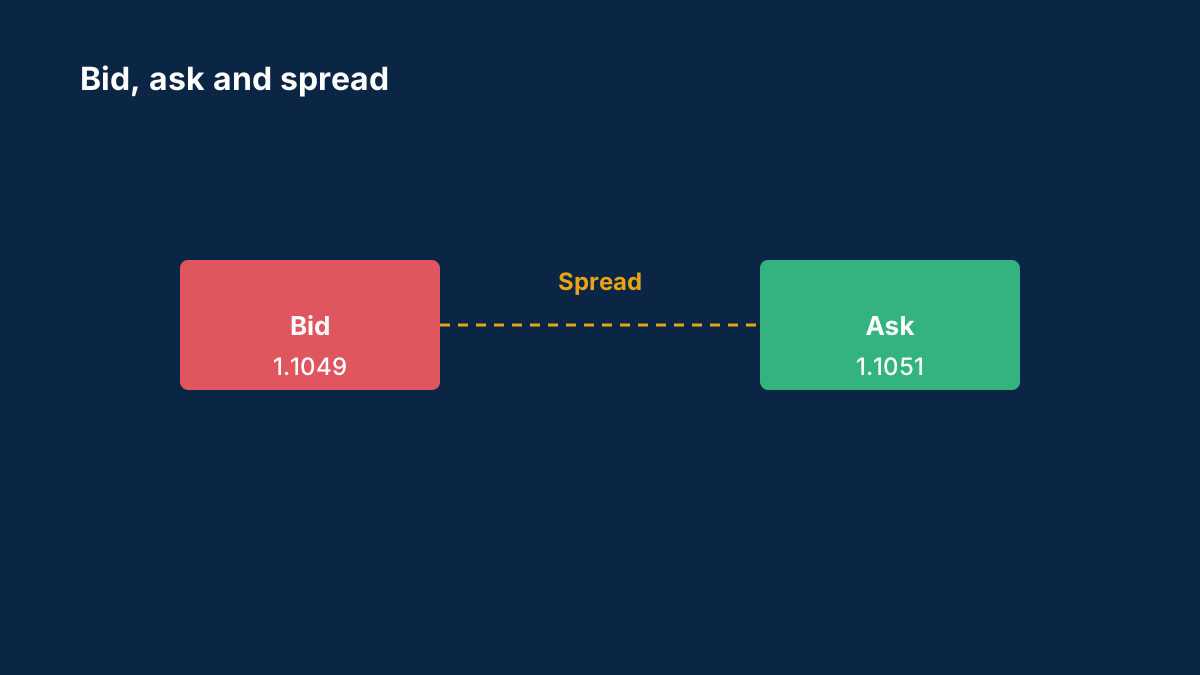
A difference of a few pips between a broker's quote and the fixing is normal: spreads, liquidity and timing all matter. What traders look for is something systematic, such as a quote that is consistently further from the market than the broker's stated spread would explain. One practical trap: many platforms show server time rather than UTC, so check which time zone your chart uses before you compare a candle with a fixing. Bid, ask and slippage explained covers why prices differ.
We would like to hear what members have actually done:
- Have you compared your platform's EUR/USD price with the ECB fixing, or another reference such as another broker's, at the same minute? How did you do it?
- What differences did you find, and how large?
- Did you screenshot or log it? What would you look at before deciding something was wrong?
- Which other reference prices do you use to check a broker?
Please describe what you observed rather than posting verdicts on a broker, and leave out account numbers and other personal details. Posts that promise returns or sell signals will be removed.
Background: Bid, ask and slippage: why your order fills at a different price
Why buy trades open at one price and close at another, why a stop can trigger when the chart never touched it, and how slippage happens.
Why did my stop-loss trigger when the price on the chart didn't reach it?
Charts usually show the bid price, but a sell position's stop is triggered by the ask. If the spread widened, the ask could have touched your stop while the bid line stayed away from it.
What is slippage?
The difference between the price you expected and the price your order was filled at. It is most common in fast or thin markets, such as around news releases.
Comments
Log in to join the discussion. Comments follow the community guidelines.
Log in to commentLoading comments…