Housing data: does it move your pairs?
Housing is a rate-sensitive sector, so its data reads as a report card on monetary policy — builder confidence, starts, prices. The market's reaction is often bigger than the data seems to deserve.
Do you follow it?
- the housing releases you watch
- how they feed your rate expectations
- the pair reactions you've observed
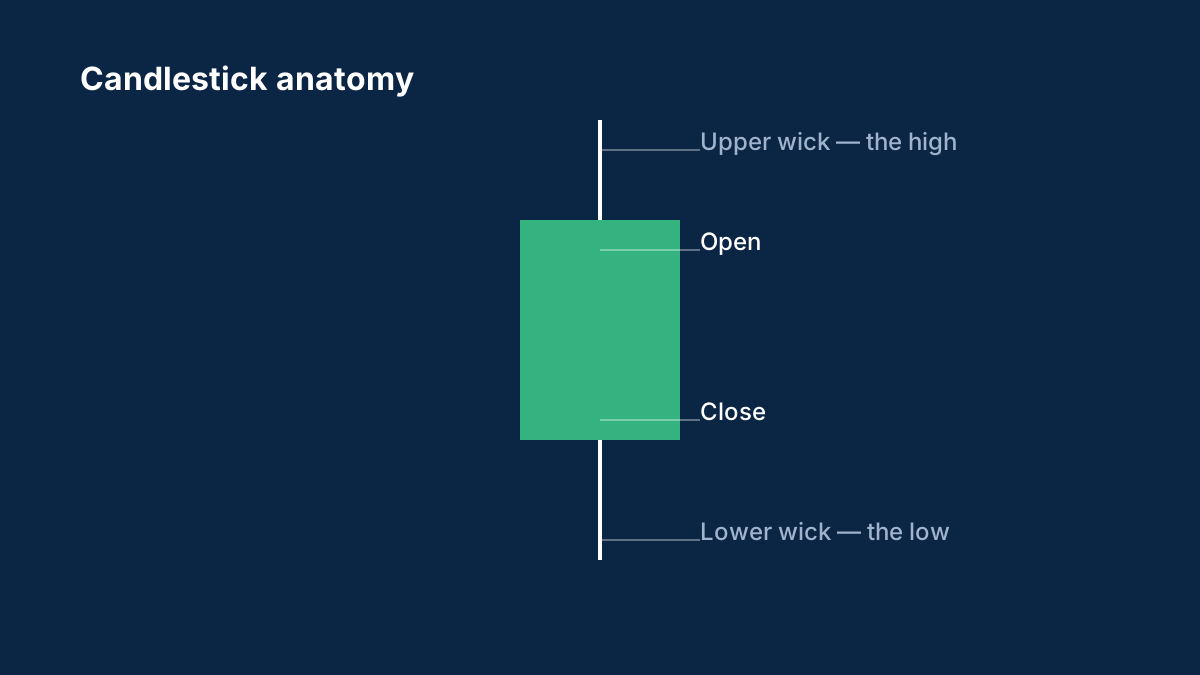
Background: the NAHB index for the latest read.
Comments
Log in to join the discussion. Comments follow the community guidelines.
Log in to commentLoading comments…