Pivot points explained: how to calculate daily pivot, support and resistance levels
Floor-trader pivot points turn yesterday's high, low and close into today's levels. Here are the formulas, a worked example and the choices forex traders need to make.
Pivot points are price levels calculated from the previous period's high, low and close. Floor traders in futures pits used them for a quick map of the day, and they're still popular because everyone using the same data gets the same levels.
The standard formulas
With the previous day's high (H), low (L) and close (C):
- Pivot (P) = (H + L + C) ÷ 3
- R1 = 2 × P − L
- S1 = 2 × P − H
- R2 = P + (H − L)
- S2 = P − (H − L)
- R3 = H + 2 × (P − L)
- S3 = L − 2 × (H − P)
A worked example
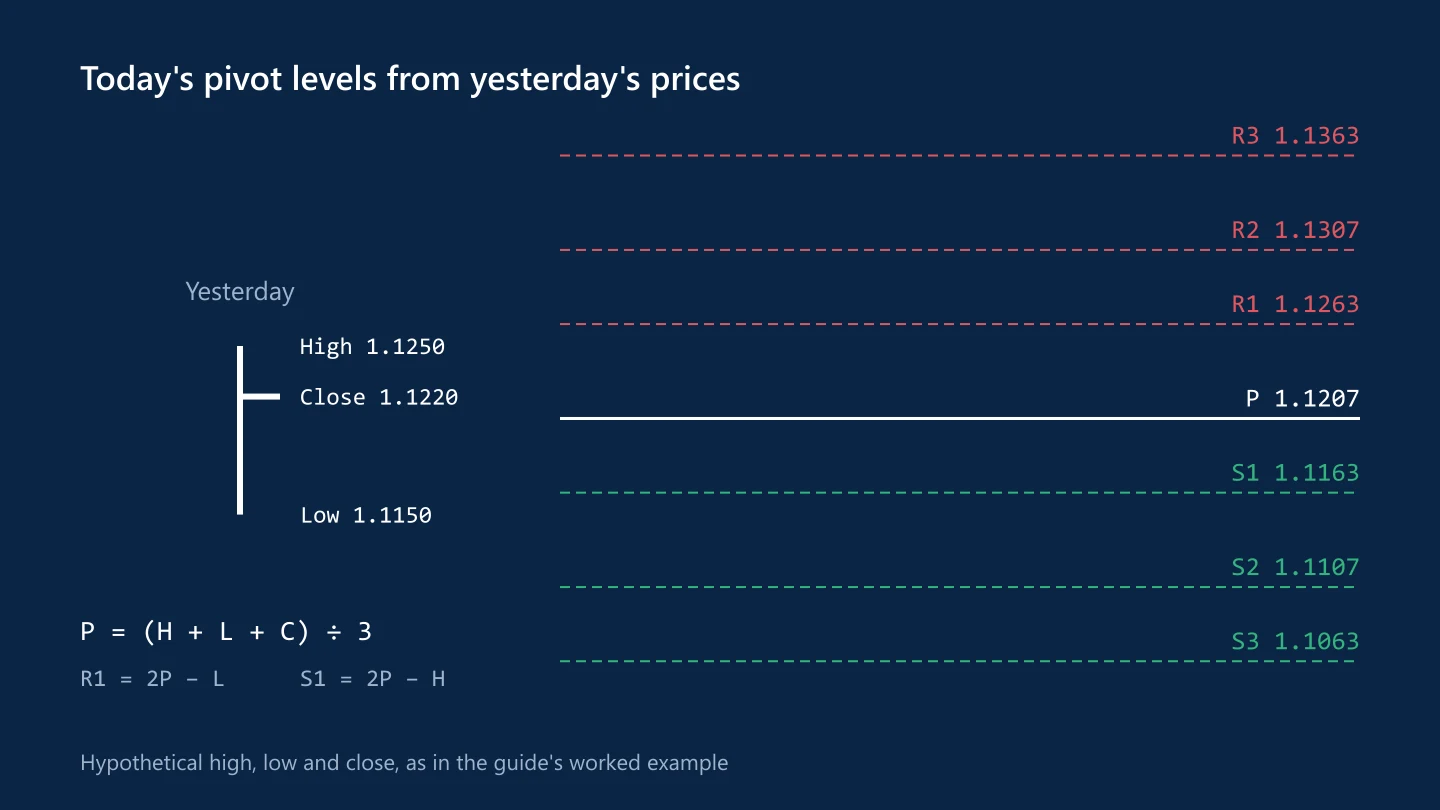
A hypothetical EUR/USD day with a high of 1.1250, a low of 1.1150 and a close of 1.1220, rounded to four decimals at the end:
- P = (1.1250 + 1.1150 + 1.1220) ÷ 3 = 1.12067, or 1.1207
- R1 = 2 × 1.12067 − 1.1150 = 1.1263
- S1 = 2 × 1.12067 − 1.1250 = 1.1163
- R2 = 1.12067 + 0.0100 = 1.1307
- S2 = 1.12067 − 0.0100 = 1.1107
- R3 = 1.1250 + 2 × 0.00567 = 1.1363
- S3 = 1.1150 − 2 × 0.00433 = 1.1063
Which close?
Forex trades around the clock, so the "day" has to be defined. The most common convention is the New York 5 p.m. close, which is also when many brokers roll positions over and charge swap. A chart set to another time zone produces different highs, lows and closes, and so different pivots. Check which session your platform uses before comparing levels with other traders.
How traders use them
- Tone for the day: price holding above the pivot is read as positive, below it as negative.
- Targets and stops: R1 and S1 are reached most often. R3 and S3 are usually only reached on days with major news.
- Confluence: a pivot level near a round number, an earlier swing or a Fibonacci retracement deserves more attention than one on its own.
Variations
Fibonacci pivots place support and resistance at 38.2%, 61.8% and 100% of the previous day's range away from the pivot. Camarilla and Woodie pivots weight the close differently and produce tighter levels. None has been shown to be better; the standard version is simply the most widely watched.
Pivots are a map drawn from yesterday's prices. On days dominated by a central bank decision or a jobs report, price can cut through several levels in minutes.
Common questions
How do you calculate a pivot point?
Add the previous period's high, low and close and divide by three. R1 is twice the pivot minus the low, and S1 is twice the pivot minus the high.
Which close do forex traders use for daily pivots?
Most use the New York 5 p.m. close to define the trading day. Charts set to other time zones produce different highs, lows and closes, and so different levels.
Are Fibonacci or Camarilla pivots better than standard pivots?
None has been shown to be better. The standard pivots are the most widely followed, which is the main reason traders watch them.
This article is for information only and is not financial advice. Trading forex and CFDs carries a high risk of losing money. Read the risk warning. Spotted an error? Tell the editors.
Comments
Log in to join the discussion. Comments follow the community guidelines.
Log in to commentLoading comments…