US home prices rise 1.9% in the year to July as Chicago leads and Seattle falls 1.6%
The S&P Cotality Case-Shiller national index gained 1.9% on the year, up from 1.6% in June, but S&P says home prices fell in real terms for a 14th consecutive month.
S&P Dow Jones Indices published the July 2026 results for the S&P Cotality Case-Shiller Indices on 29 September. The National Home Price Index, covering all nine US census divisions, rose 1.9% from a year earlier, up from 1.6% in June. The 10-City Composite rose 3.4%, up from 3.0%, and the 20-City Composite rose 2.5%, up from 2.2%.
Winners and losers
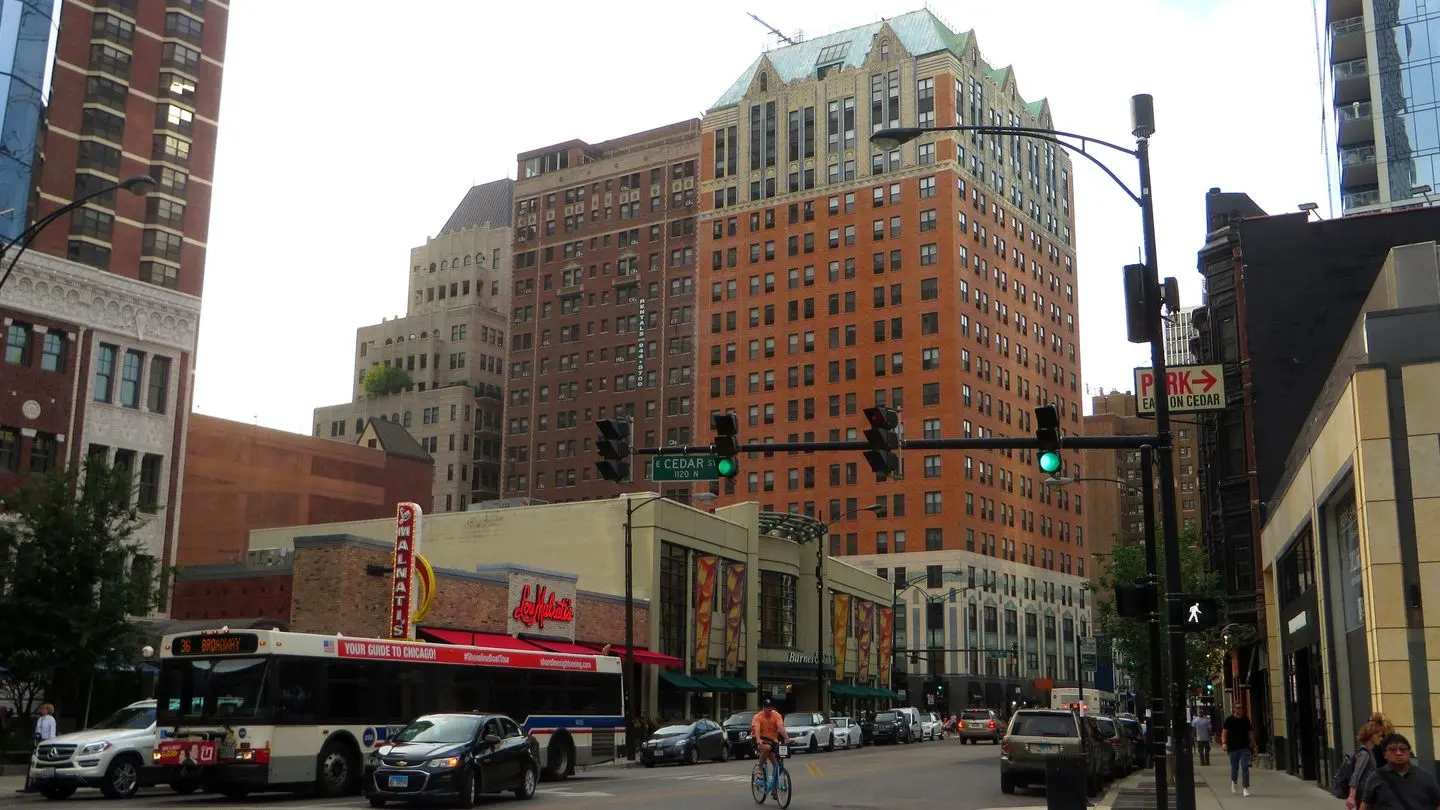
- Chicago: +6.9%, the highest annual gain among the 20 cities for the fifth consecutive month
- New York: +5.8%
- Cleveland: +4.2%
- Seattle: −1.6%, the largest annual decline for the second consecutive month
- Las Vegas: −1.3%
- Denver: −1.1%
Detroit has no valid July figure because of transaction delays at the recording office in Wayne County; S&P provides a June update instead. Rebecca Kaufman, S&P's associate director of commodities, noted that the East–West divide persists: six of the eight Eastern markets recorded larger annual gains in July than in June, against two of the eight Western markets.
Month on month
Before seasonal adjustment, the National index rose 0.12%, the 10-City 0.03% and the 20-City fell 0.01%. After seasonal adjustment they rose 0.3%, 0.4% and 0.3%. S&P describes this as a departure from the usual seasonal pattern, suggesting seasonal factors weighed heavily on July prices.
Where the indices stand against the last cycle
Compared with the June 2022 peak, the National index (336.66) is 9.3% higher, the 20-City (350.20) is 9.9% higher and the 10-City (373.49) is 13.0% higher. From the January 2023 trough they are up 15.0%, 17.7% and 20.5%.

Real prices are falling
Kaufman said home prices declined in real terms for a 14th consecutive month, because consumer price inflation of 3.4% exceeded the 1.9% rise in house prices. She added that much of the inflation was concentrated in energy, so shelter and other core categories matter more for housing affordability. The latest inflation figures are in our reports on CPI and PCE.
Housing activity data for August were mixed: new home sales rose 6.4% with the average price down 8.8% on a year earlier (report), and existing home sales are covered in our report. The next Case-Shiller release, for August, is due at the end of October. Live prices: EUR/USD.
Sources
Common questions
How much did US home prices rise in the year to July 2026?
The S&P Cotality Case-Shiller National Index rose 1.9%, the 10-City Composite 3.4% and the 20-City Composite 2.5%.
Which US cities had the biggest home price gains and falls in July 2026?
Chicago led with +6.9%, followed by New York (+5.8%) and Cleveland (+4.2%). Seattle fell 1.6%, Las Vegas 1.3% and Denver 1.1%.
What does a real decline in home prices mean?
It means prices rose by less than consumer price inflation. S&P says home prices fell in real terms for the 14th consecutive month in July 2026.
This article is for information only and is not financial advice. Trading forex and CFDs carries a high risk of losing money. Read the risk warning. Spotted an error? Tell the editors.



Comments
Log in to join the discussion. Comments follow the community guidelines.
Log in to commentLoading comments…