Head and shoulders, double tops and double bottoms explained
Reversal patterns are confirmed at a neckline. Learn how head and shoulders and double top patterns form, where confirmation comes and how measured targets are set.
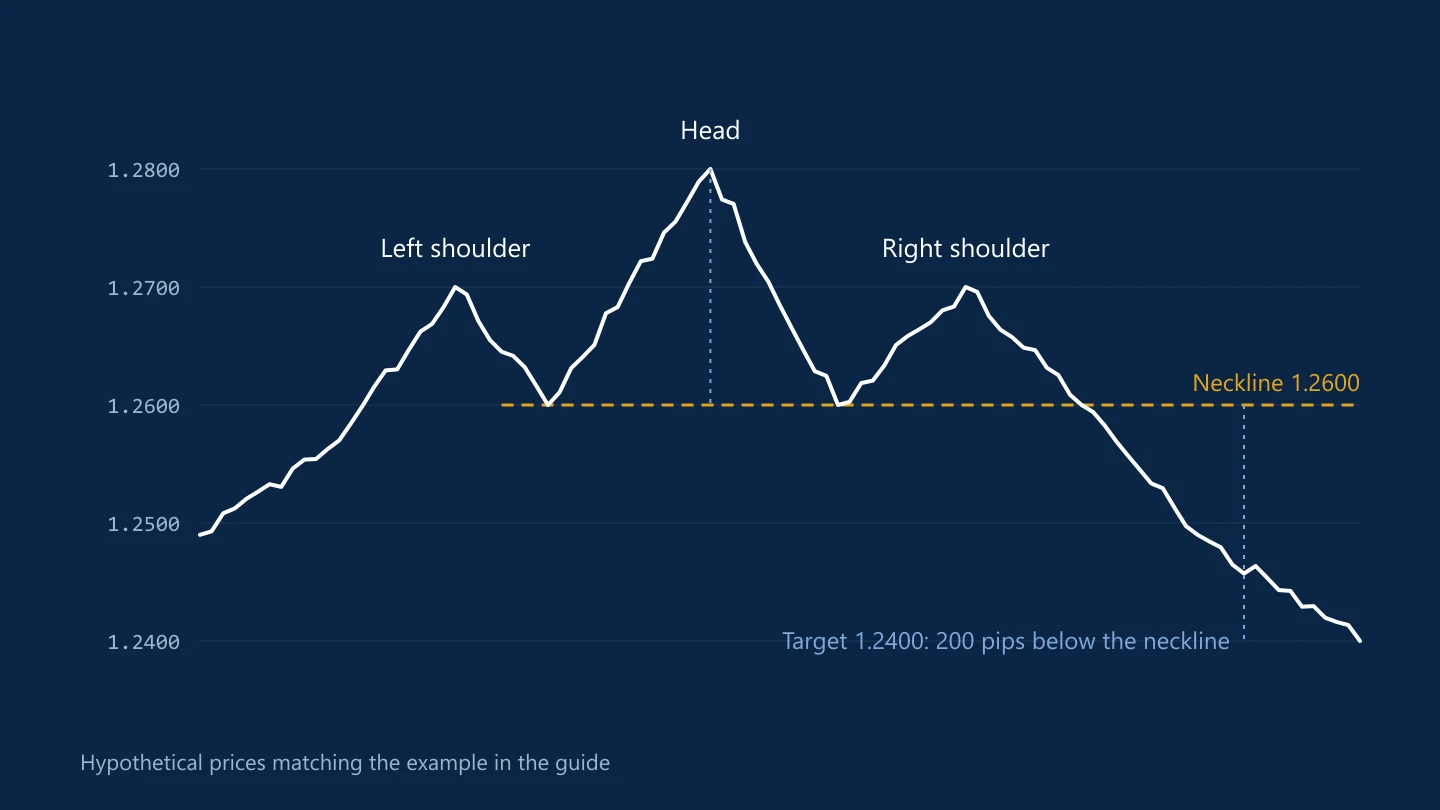
Reversal patterns describe a trend running out of strength: buyers try to push higher and fail, or sellers try to push lower and fail. Two of the most widely followed are the head and shoulders and the double top or bottom.
Head and shoulders
The pattern forms after an uptrend, in three peaks:
- Left shoulder: a rally to a high, then a pullback
- Head: a rally to a higher high, then a pullback to around the same area as the first
- Right shoulder: a weaker rally that fails below the head, then a decline
The neckline connects the two pullback lows on either side of the head. The pattern is only complete when price closes below the neckline. Until then, it's three peaks in an uptrend, and many shapes that look like a head and shoulders never break.
An inverse head and shoulders is the same shape upside down. It forms after a downtrend and is confirmed by a close above the neckline.
Double tops and double bottoms
A double top is two peaks at a similar level with a pullback low between them. The neckline runs through that low, and a close below it confirms the pattern. A double bottom is the reverse: two lows at a similar level, confirmed by a close above the high between them.
The second peak doesn't need to match the first to the pip. What matters is that buyers failed to push meaningfully beyond the earlier high.
Measured move targets
Traders often project a target from the height of the pattern:
- Head and shoulders: measure from the top of the head to the neckline, then project that distance down from the break.
- Double top: measure from the peaks to the neckline and project it down from the break.
A hypothetical example: a head at 1.2800 and a neckline at 1.2600 give a height of 200 pips, so a break at 1.2600 projects to 1.2400. Targets like this are rough guides. Price may stop well short at earlier support, or run much further.
Trading the patterns with discipline
- Wait for the break. Acting before the neckline breaks means betting against a trend that is still in place.
- Expect retests. Price often comes back to the broken neckline before moving on, and some traders enter there.
- Put the stop where the idea is wrong. Above the right shoulder is the usual choice for a head and shoulders; above the second peak for a double top.
- Compare reward with risk. If the stop is far away and the measured target is close, the trade may not be worth taking; see risk-reward and expectancy.
Patterns are easy to spot in hindsight and much harder in real time. Mark them on past charts, including the ones that failed, before trusting your eye with real money. The swing points these patterns are built from are covered in how to read candlestick charts.
Common questions
When is a head and shoulders pattern confirmed?
When price closes beyond the neckline, the line through the pullback lows on either side of the head. Before that break, the pattern is incomplete.
How do you calculate a head and shoulders target?
Measure the distance from the top of the head to the neckline and project it from the point where price breaks the neckline. Treat the result as a rough guide.
What is the difference between a double top and a double bottom?
A double top forms after a rise, with two highs at a similar level, and is confirmed by a break below the low between them. A double bottom is the reverse, forming after a fall.
This article is for information only and is not financial advice. Trading forex and CFDs carries a high risk of losing money. Read the risk warning. Spotted an error? Tell the editors.
Comments
Log in to join the discussion. Comments follow the community guidelines.
Log in to commentLoading comments…