Momentum trading: how do you actually measure momentum?
Momentum means the move is continuing — but traders measure it a dozen ways: rate of change, MACD, RSI slope, consecutive closes, ADX. The measurement defines the strategy.
What's your momentum definition?
- the indicator or price measure you use
- how you enter and exit momentum trades
- the regime where momentum fails for you
The MACD guide and moving averages cover two classic measurements.
Background: Moving averages explained: SMA and EMA
Moving averages smooth out price noise to show the trend. How simple and exponential averages are calculated, which periods traders use and where they fail.
What is the difference between SMA and EMA?
An SMA weights every period equally. An EMA gives more weight to recent prices, so it responds faster to new moves but can give more false signals.
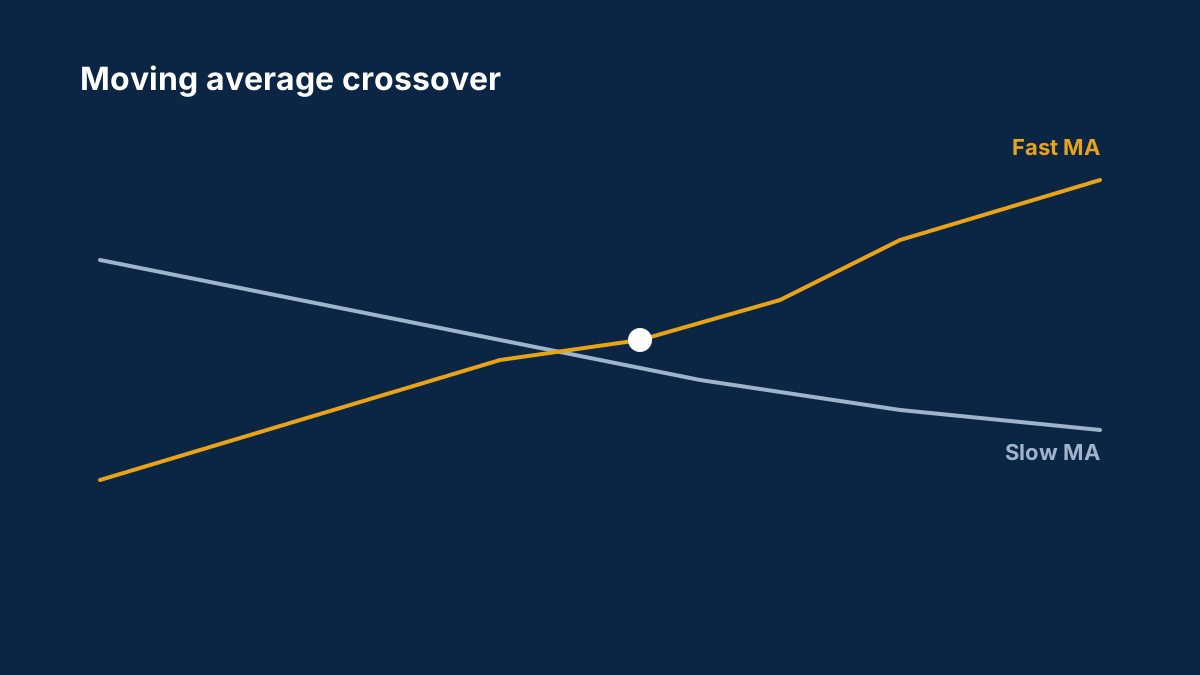
What is a golden cross?
When a shorter moving average, typically the 50-period, crosses above a longer one, typically the 200-period. Many traders read it as a sign of a strengthening uptrend.
Comments
Log in to join the discussion. Comments follow the community guidelines.
Log in to commentLoading comments…