Tick data versus candle tests: what's the difference in results?
Testing on candles assumes one price per bar; tick data replays every price change. For intraday strategies the difference is large — fills inside a candle can change everything.
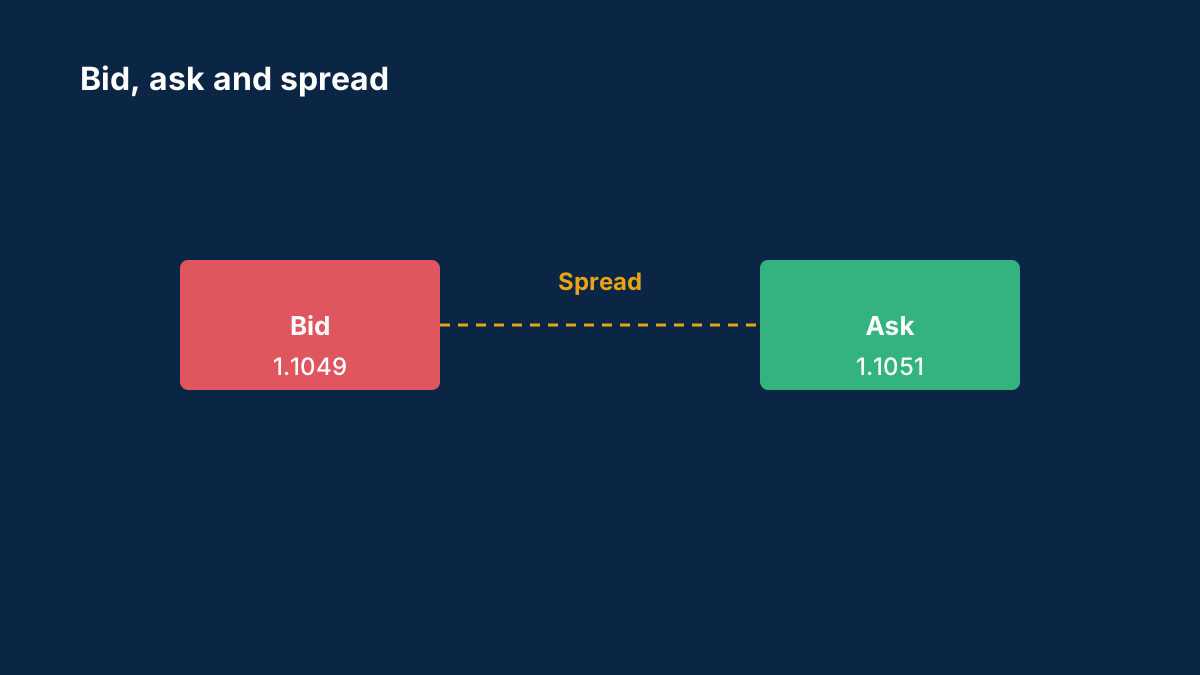
Have you compared?
- the strategy and the two test results
- where the candle test flattered the outcome
- whether tick testing changed your mind about the strategy
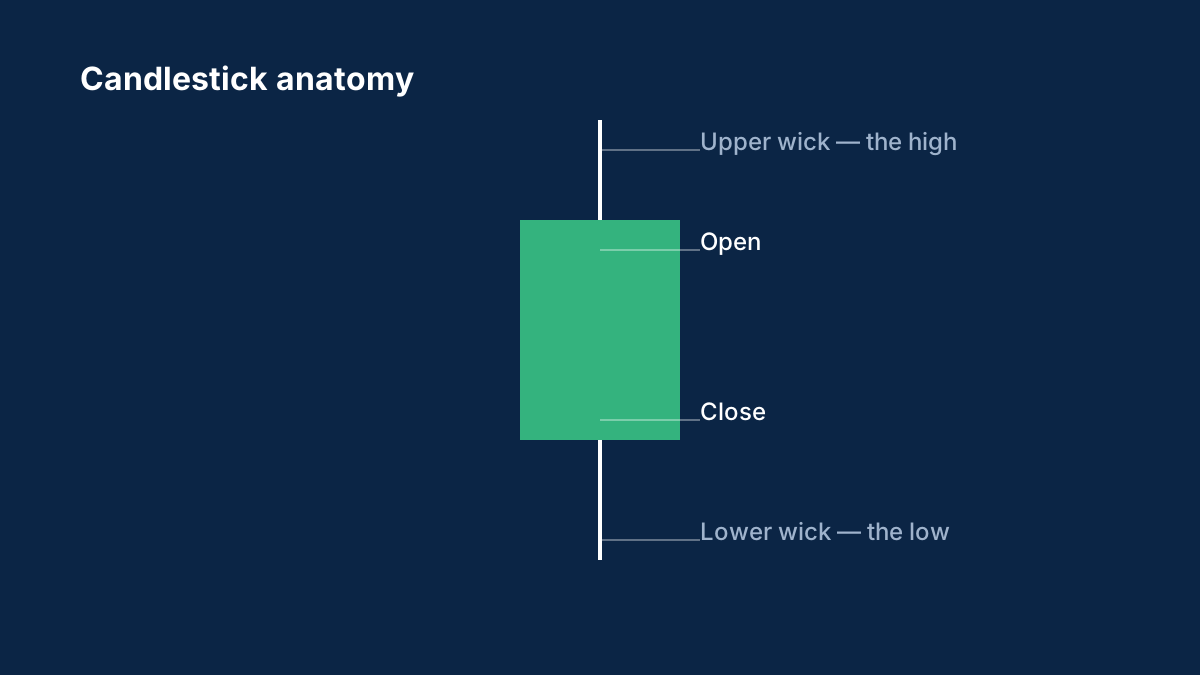
The bid, ask and slippage guide explains why intra-bar prices matter.
Background: Bid, ask and slippage: why your order fills at a different price
Why buy trades open at one price and close at another, why a stop can trigger when the chart never touched it, and how slippage happens.
Why did my stop-loss trigger when the price on the chart didn't reach it?
Charts usually show the bid price, but a sell position's stop is triggered by the ask. If the spread widened, the ask could have touched your stop while the bid line stayed away from it.
What is slippage?
The difference between the price you expected and the price your order was filled at. It is most common in fast or thin markets, such as around news releases.
Comments
Log in to join the discussion. Comments follow the community guidelines.
Log in to commentLoading comments…