Stochastic: does anyone still use it?
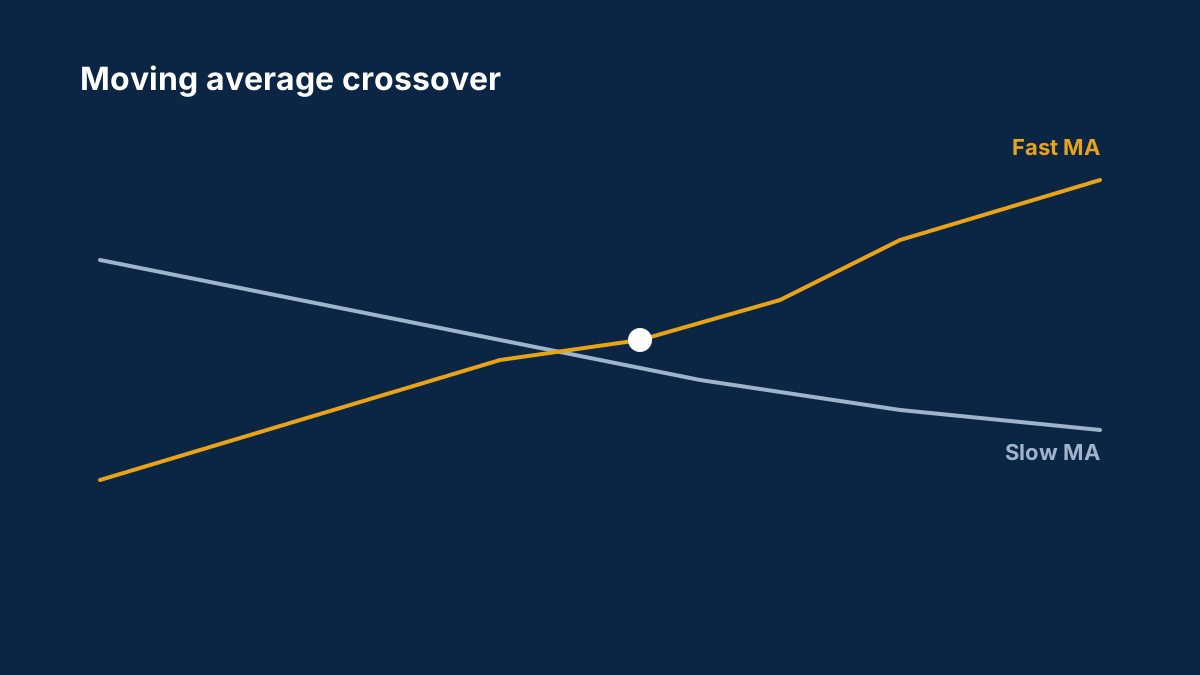
The stochastic oscillator predates most modern indicators and still appears on default chart templates everywhere. Its overbought/oversold reads and crossovers have a mixed reputation that some traders defend.
What's your experience?

- the stochastic settings and signals you use
- how it compares with RSI in your trading
- why you kept it or dropped it
The RSI guide covers the stochastic's modern cousin.
Background: The RSI indicator explained: overbought, oversold and divergence
The Relative Strength Index measures how strong recent moves have been. How it is calculated, what 70 and 30 really mean and why RSI can stay extreme in a trend.
What does RSI above 70 mean?
That recent gains have been strong compared with recent losses. It is called overbought, but in a strong uptrend the price can keep rising while RSI stays above 70.
What is the best RSI setting?
The standard is 14 periods, as Wilder proposed. Shorter settings react faster with more false signals; longer settings are smoother. There is no single best setting.
Comments
Log in to join the discussion. Comments follow the community guidelines.
Log in to commentLoading comments…