MACD plus RSI: do the two momentum tools ever agree?
Stacking two momentum oscillators looks like confirmation — but both derive from the same price action, so the "agreement" is partly redundancy. The useful version assigns each a distinct job.
How do you use them together?
- the role you give each tool
- how you handle their disagreements
- what the pair adds that one alone doesn't
The MACD guide and RSI guide explain what each measures.
Background: The MACD indicator explained: signal line, histogram and divergence
MACD measures the gap between two exponential moving averages. Here is how the line, signal line and histogram are calculated, and the ways traders read them.
What do the MACD settings 12, 26 and 9 mean?
The MACD line is the 12-period exponential moving average minus the 26-period one, and the signal line is a 9-period exponential moving average of the MACD line.
What is a MACD crossover?
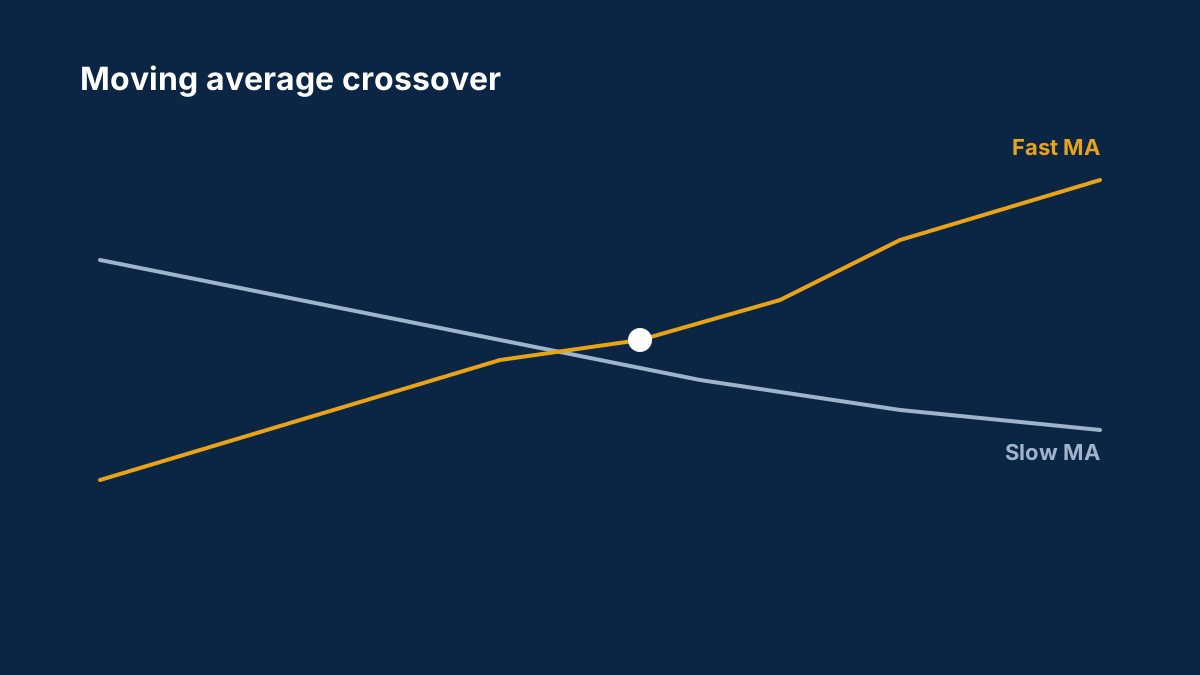
When the MACD line crosses its signal line. Crossing above is read as bullish momentum and below as bearish, but crossovers give many false signals in sideways markets.
Comments
Log in to join the discussion. Comments follow the community guidelines.
Log in to commentLoading comments…