Moving averages: what's your actual setup?
The moving average is the oldest tool in technical analysis and the most customised: SMA or EMA, 20 or 200, one line or three, crossovers or price-versus-line. Everyone's setup is personal and almost nobody's is documented.
Share yours:
- the averages, periods and time frame
- exactly how you use them (filter, entry, exit, all three)
- what your setup is bad at

The moving averages guide explains what each choice actually changes.
Background: Moving averages explained: SMA and EMA
Moving averages smooth out price noise to show the trend. How simple and exponential averages are calculated, which periods traders use and where they fail.
What is the difference between SMA and EMA?
An SMA weights every period equally. An EMA gives more weight to recent prices, so it responds faster to new moves but can give more false signals.
What is a golden cross?
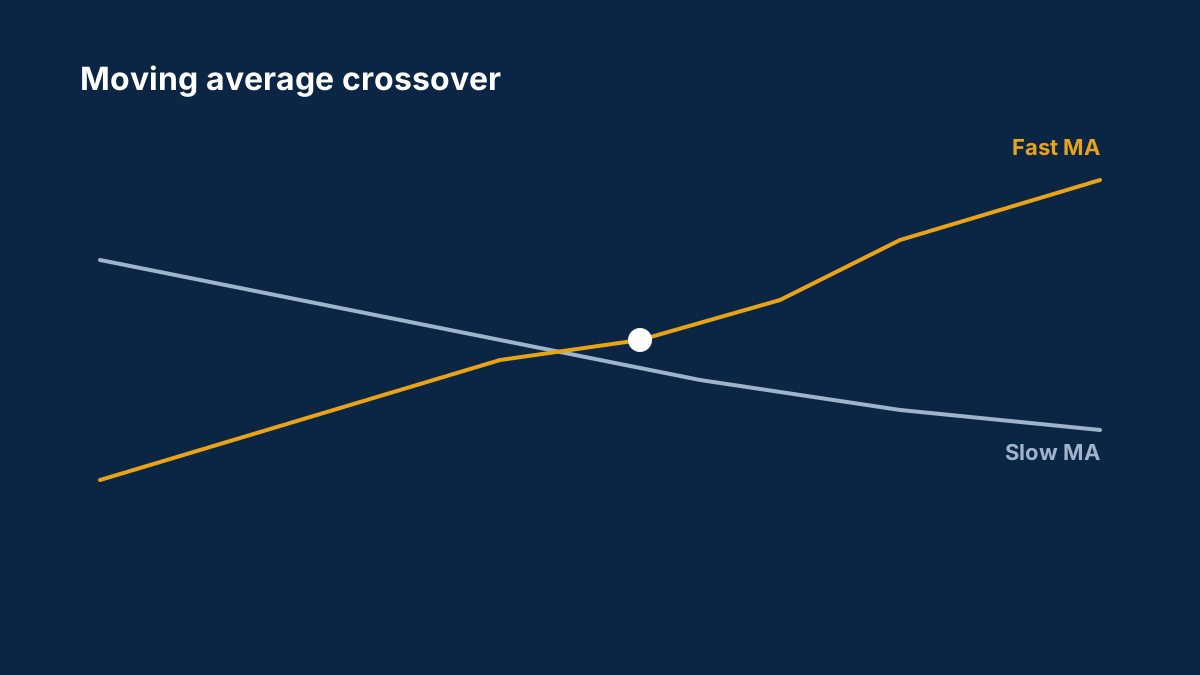
When a shorter moving average, typically the 50-period, crosses above a longer one, typically the 200-period. Many traders read it as a sign of a strengthening uptrend.
Comments
Log in to join the discussion. Comments follow the community guidelines.
Log in to commentLoading comments…