Stop-hunting: fact or venting?
"They ran my stop" is the trader's favourite explanation for losses. The truth is more mundane: obvious stops cluster at obvious levels, and price runs through them because that's what price does at liquidity.

What's your view?
- whether your broker or the market is "hunting" stops
- how you place stops to avoid the obvious clusters
- the loss you blamed on stop-hunting, honestly reassessed
The stop-loss guide explains the clustering dynamics.
Background: Where to place a stop-loss: structure, volatility and time stops
A stop-loss belongs where your trade idea is proven wrong, not at a round number of pips. Here are the main methods and the mistakes that trigger stops early.
How far away should a stop-loss be?
Far enough that normal price movement doesn't reach it, at the point where the reason for the trade would be proven wrong. The position size should then be set so that distance costs a fixed share of the account.
Why was my stop-loss hit when the chart didn't reach it?
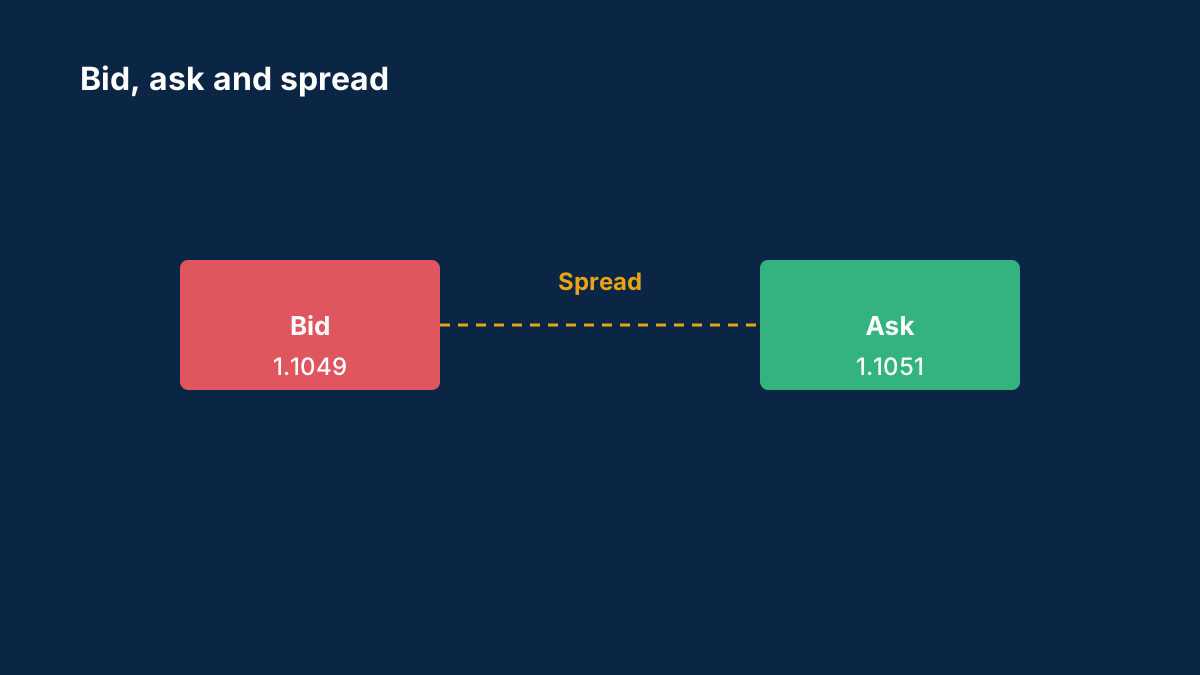
Charts usually show the bid price, but sell positions are closed at the ask. When the spread widens, the ask can reach a sell stop while the bid line on the chart stays below it.
Comments
Log in to join the discussion. Comments follow the community guidelines.
Log in to commentLoading comments…